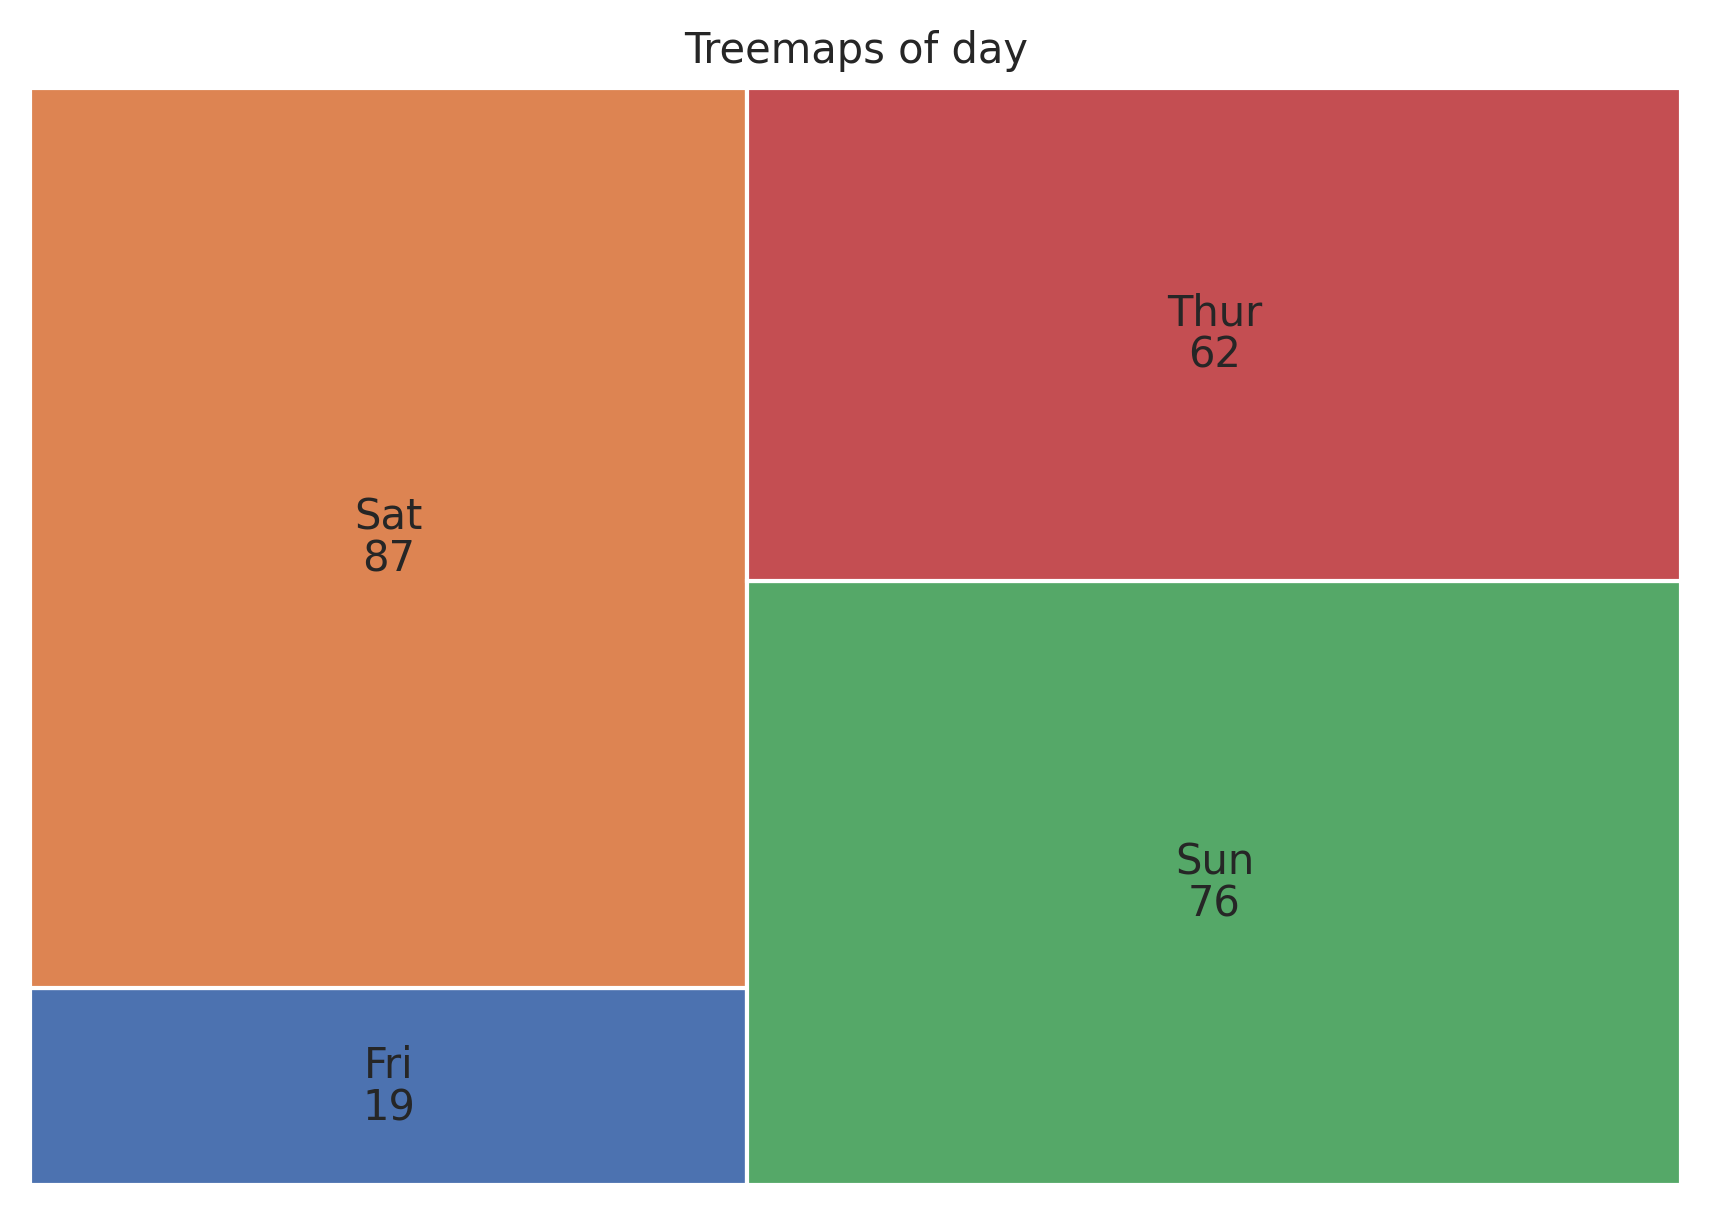
Treemaps Plot
Display hierarchical data as nested rectangles.
plot: 'treemapsplot'
Plot-Specific Parameters
norm_x(float, default: 100)x value for normalization.
norm_y(float, default: 100)y value for normalization.
color(list or None, default: None)A sequence of colors through which the treemaps chart will cycle. If None, will use the colors in the currently active cycle.
treemaps_pad(bool, default: False)Draw rectangles with a small gap between them.
bar_kwargs(dict or None, default: None)Keyword arguments passed to matplotlib.Axes.bar.
text_kwargs(dict or None, default: None)Keyword arguments passed to matplotlib.Axes.text.
from grplot import plot2d
import grplot_seaborn as gs
gs.set_theme(context='notebook', style='darkgrid', palette='deep')

tips = gs.load_dataset('tips')
ax = plot2d(plot='treemapsplot',
            df=tips,
            x='day',
            sep='.',
            text=True,
            title='Treemaps of day')