Rug Plot
Plot marginal distributions by drawing ticks along the x and y axes.
Commonly combined with kdeplot.
plot: 'rugplot'
Plot-Specific Parameters
hue(str, list, numpy.ndarray, pandas.core.indexes.base.Index, or None, default: None)Semantic variable that is mapped to determine the color of plot elements.
height(float, default: 0.025)Proportion of axes extent covered by each rug element.
expand_margins(bool, default: True)If True, increase the axes margins by the height of the rug to avoid overlap with other elements.
palette(str, list, matplotlib.colors.Colormap, or None, default: None)Method for choosing the colors to use when mapping the hue semantic. String values are passed to color_palette(). List values imply categorical mapping, while a colormap object implies numeric mapping.
hue_order(list or None, default: None)Specify the order of processing and plotting for categorical levels of the hue semantic.
hue_norm(tuple, matplotlib.colors.Normalize, or None, default: None)Either a pair of values that set the normalization range in data units or an object that will map from data units into a 0 until 1 interval. Usage implies numeric mapping.
legend(bool, default: True)If False, do not add a legend for semantic variables.
alpha(float or None, default: None)Proportional opacity of the points.
zorder(int or None, default: None)Axes order. The default drawing order for axes is patches, lines, text for each plot order.
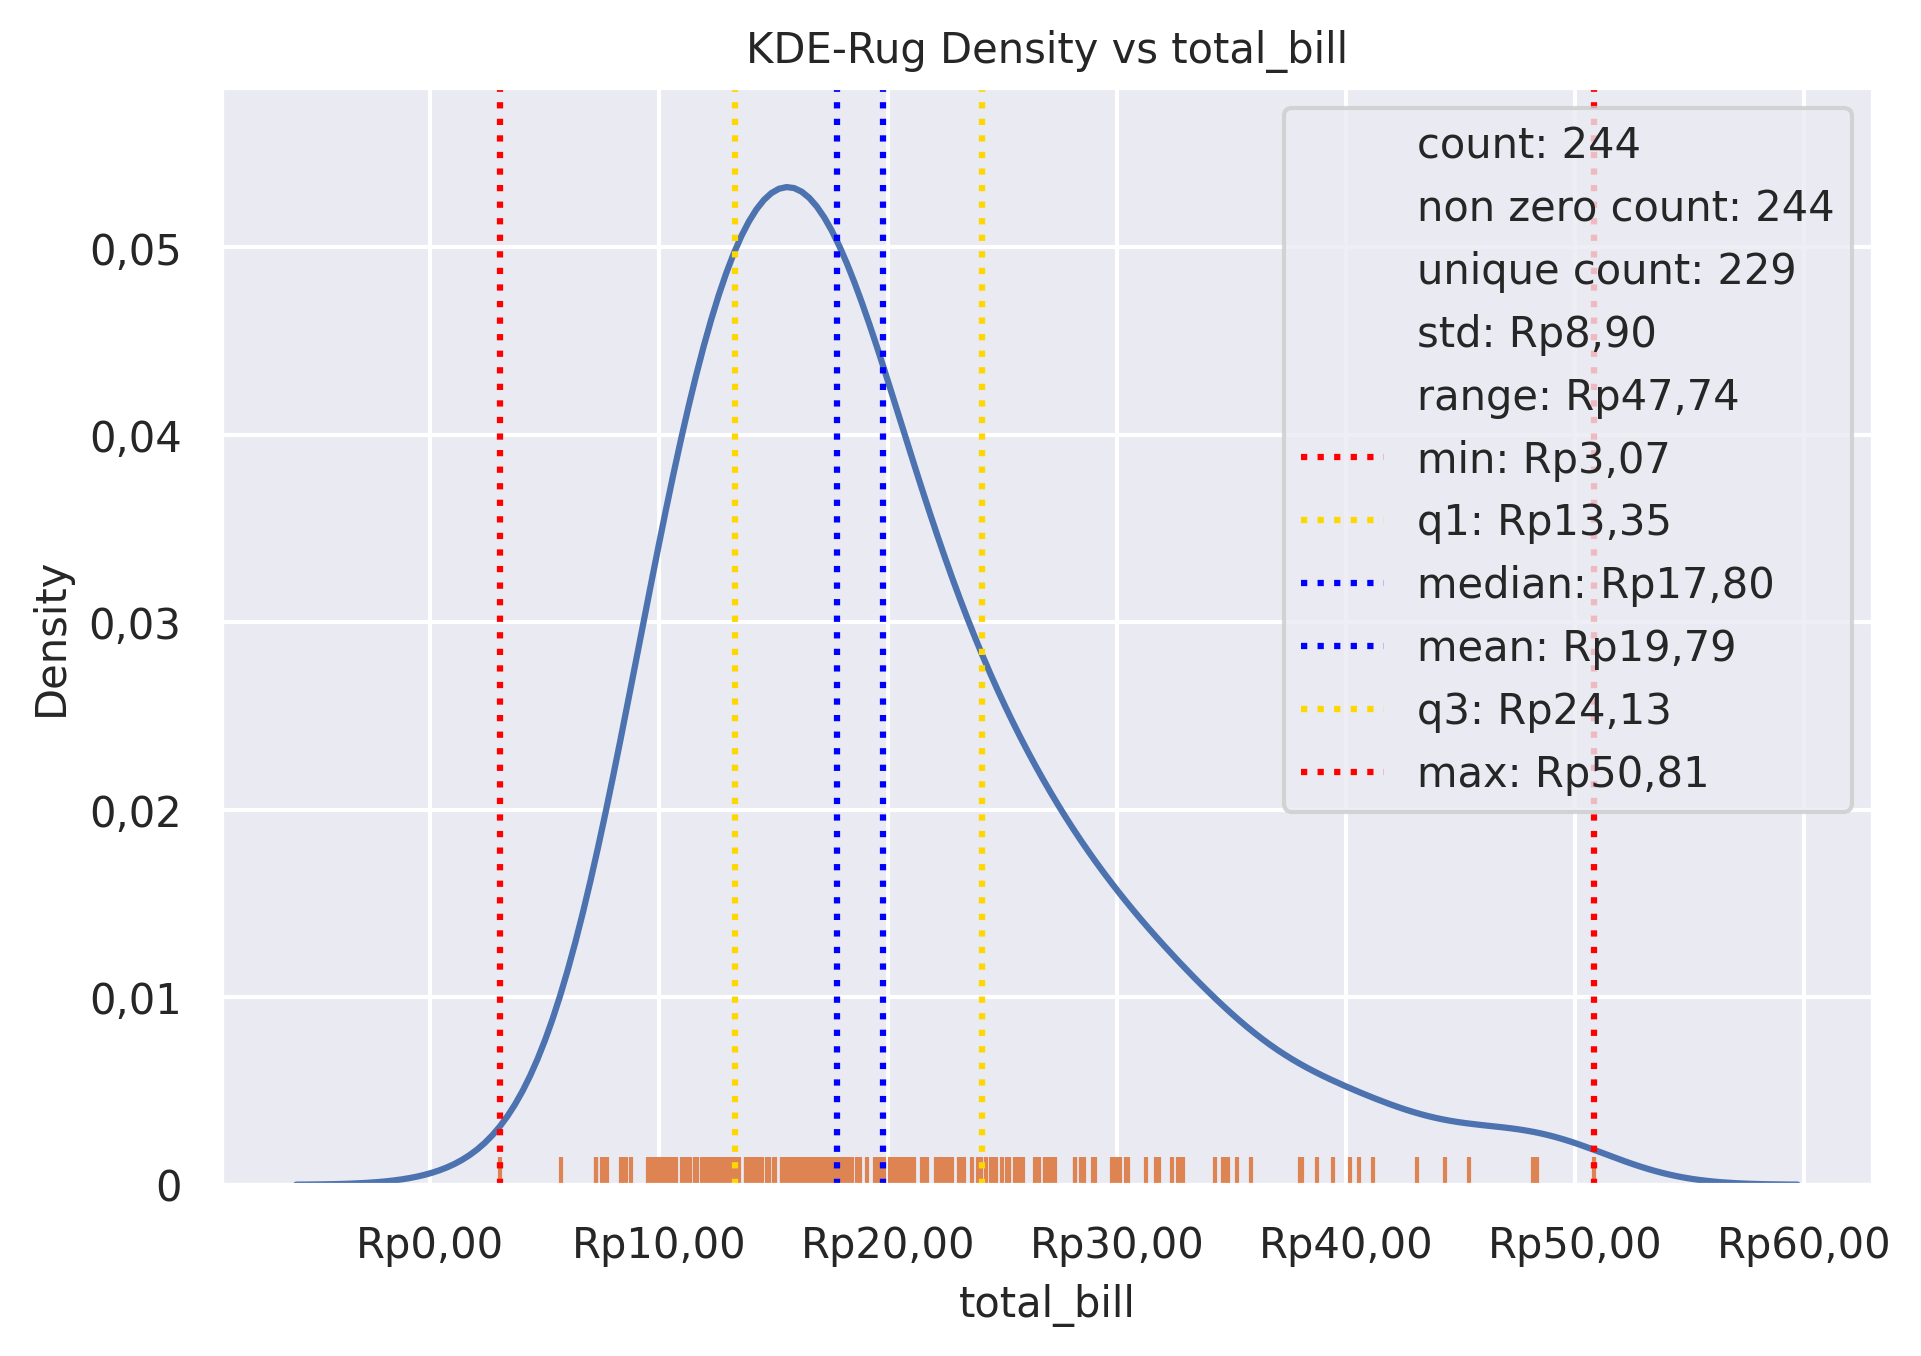
Example 1
from grplot import plot2d
import grplot_seaborn as gs
gs.set_theme(context='notebook', style='darkgrid', palette='deep')

tips = gs.load_dataset('tips')
ax = plot2d(plot='kdeplot+rugplot',
            df=tips,
            x='total_bill',
            xsep='.c',
            ysep='.',
            statdesc={'total_bill': 'general'},
            xtick_add='Rp(_)',
            title='KDE-Rug Density vs total_bill')
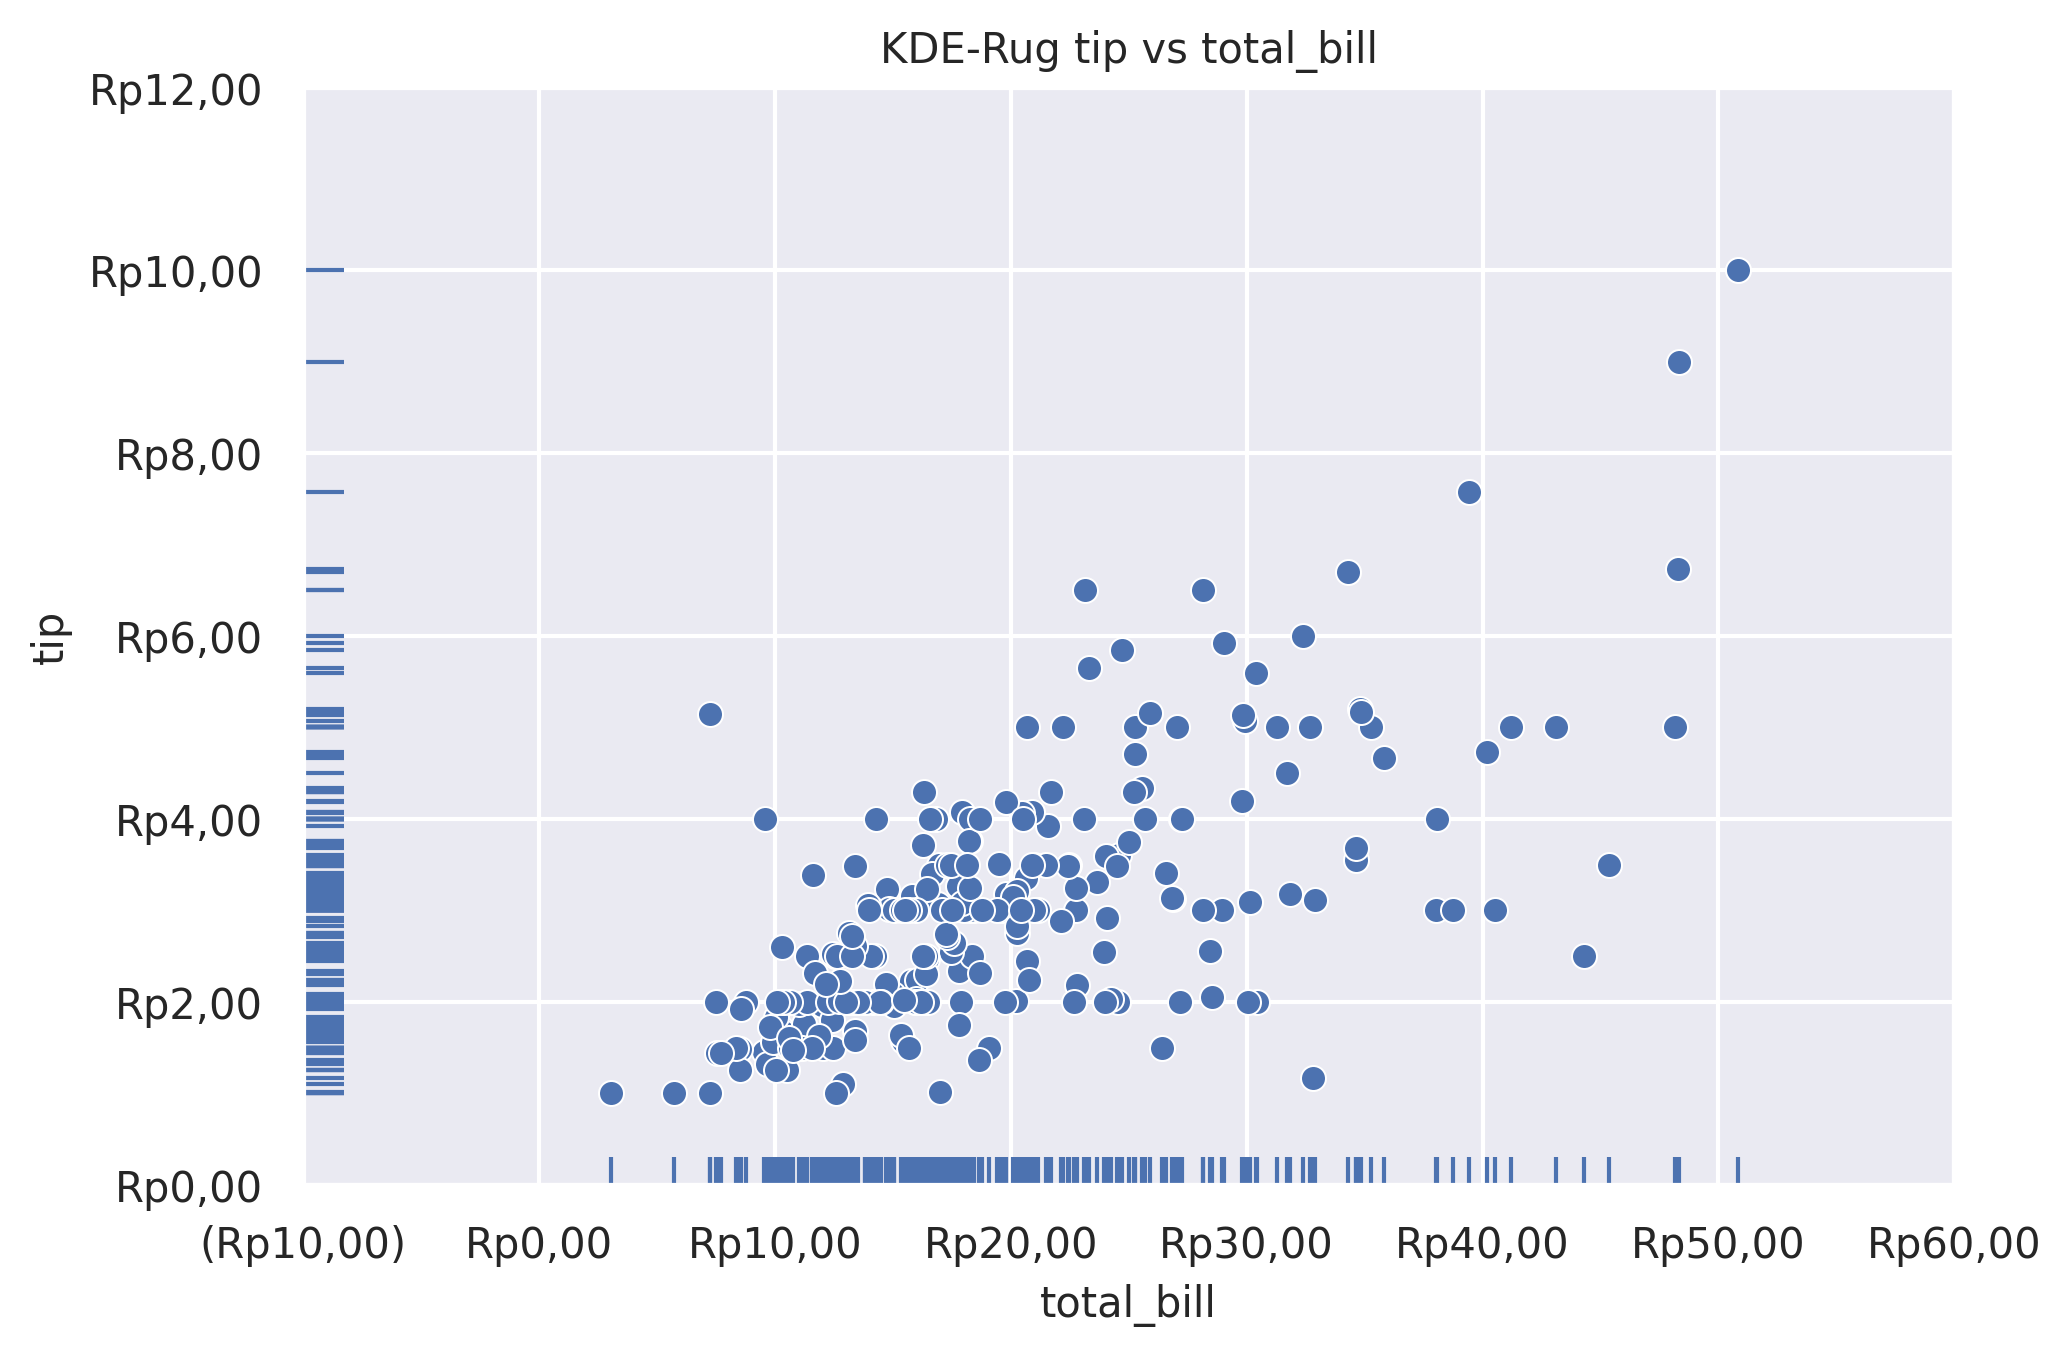
Example 2
from grplot import plot2d
import grplot_seaborn as gs
gs.set_theme(context='notebook', style='darkgrid', palette='deep')


tips = gs.load_dataset('tips')
ax = plot2d(plot='scatterplot+rugplot',
            df=tips,
            x='total_bill',
            y='tip',
            sep='.c',
            tick_add='Rp(_)',
            title='Scatter-Rug tip vs total_bill')