Dashboard-Like
Combine multiple plot types and subplots in a single plot2d call.
Plot types are layered within a subplot using +.
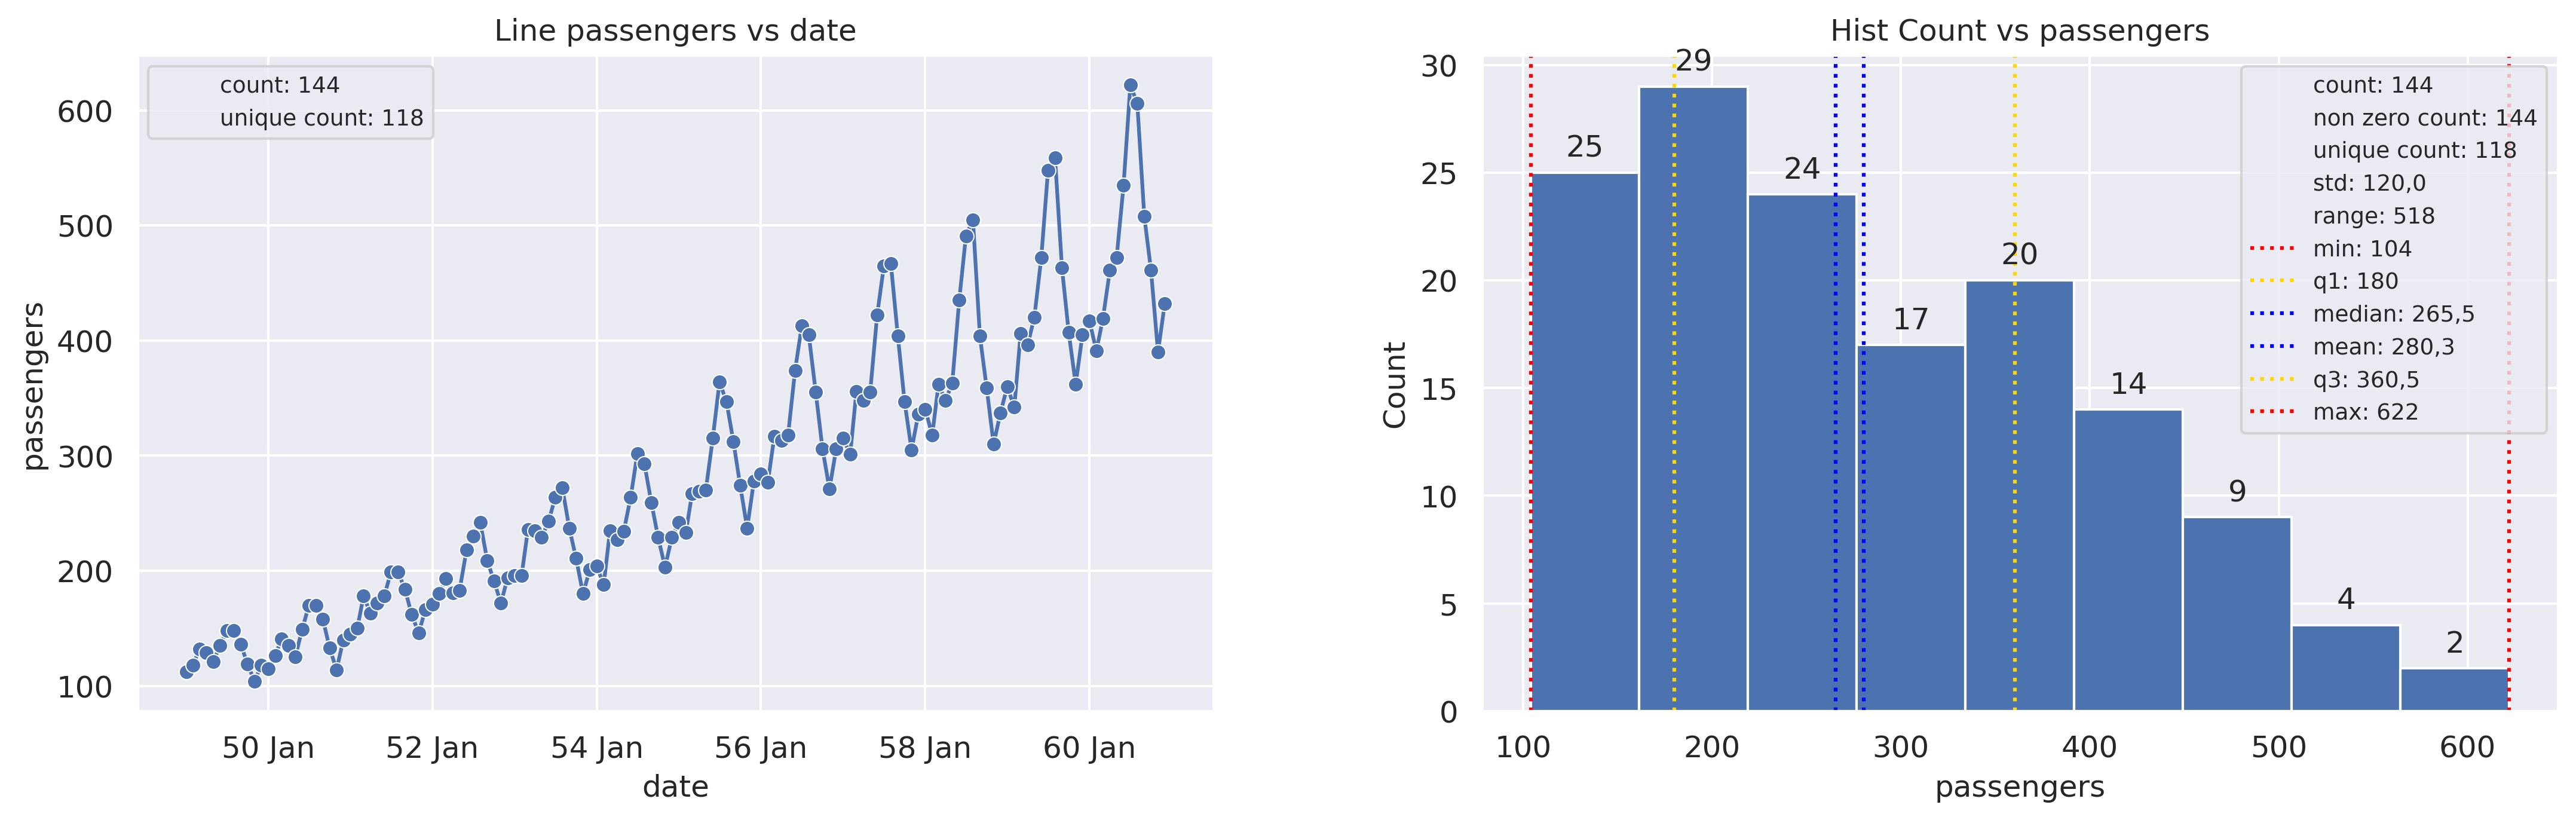
1 Dimensional
A 1-row, 2-column dashboard using the flights dataset. Subplot addresses
use '[i]' notation (single-row figures).
from grplot import plot2d
import grplot_seaborn as gs
import pandas as pd

gs.set_theme(context='notebook', style='darkgrid', palette='deep')

flights = gs.load_dataset('flights')
flights['month'] = flights['month'].cat.codes + 1
flights['date'] = pd.to_datetime(flights[['year', 'month']].assign(DAY=1))
flights = flights.drop(labels=['year', 'month'], axis=1)
ax = plot2d(plot={'[1]': 'lineplot+scatterplot', '[2]': 'histplot'},
            Nx=2,
            Ny=1,
            df=flights,
            x=['date', 'passengers'],
            y=['passengers', None],
            figsize=[16, 6],
            fontsize=12,
            legend_fontsize=9,
            sep={'passengers': '.', 'year': None},
            xdt={'[1]': '%y %b'},
            ytext={'[2]': 'h'},
            statdesc={'[1]': {'passengers': 'count+unique'},
                      '[2]': {'passengers': 'general'}},
            title={'[1]': 'Line passengers vs date',
                   '[2]': 'Hist Count vs passengers'})
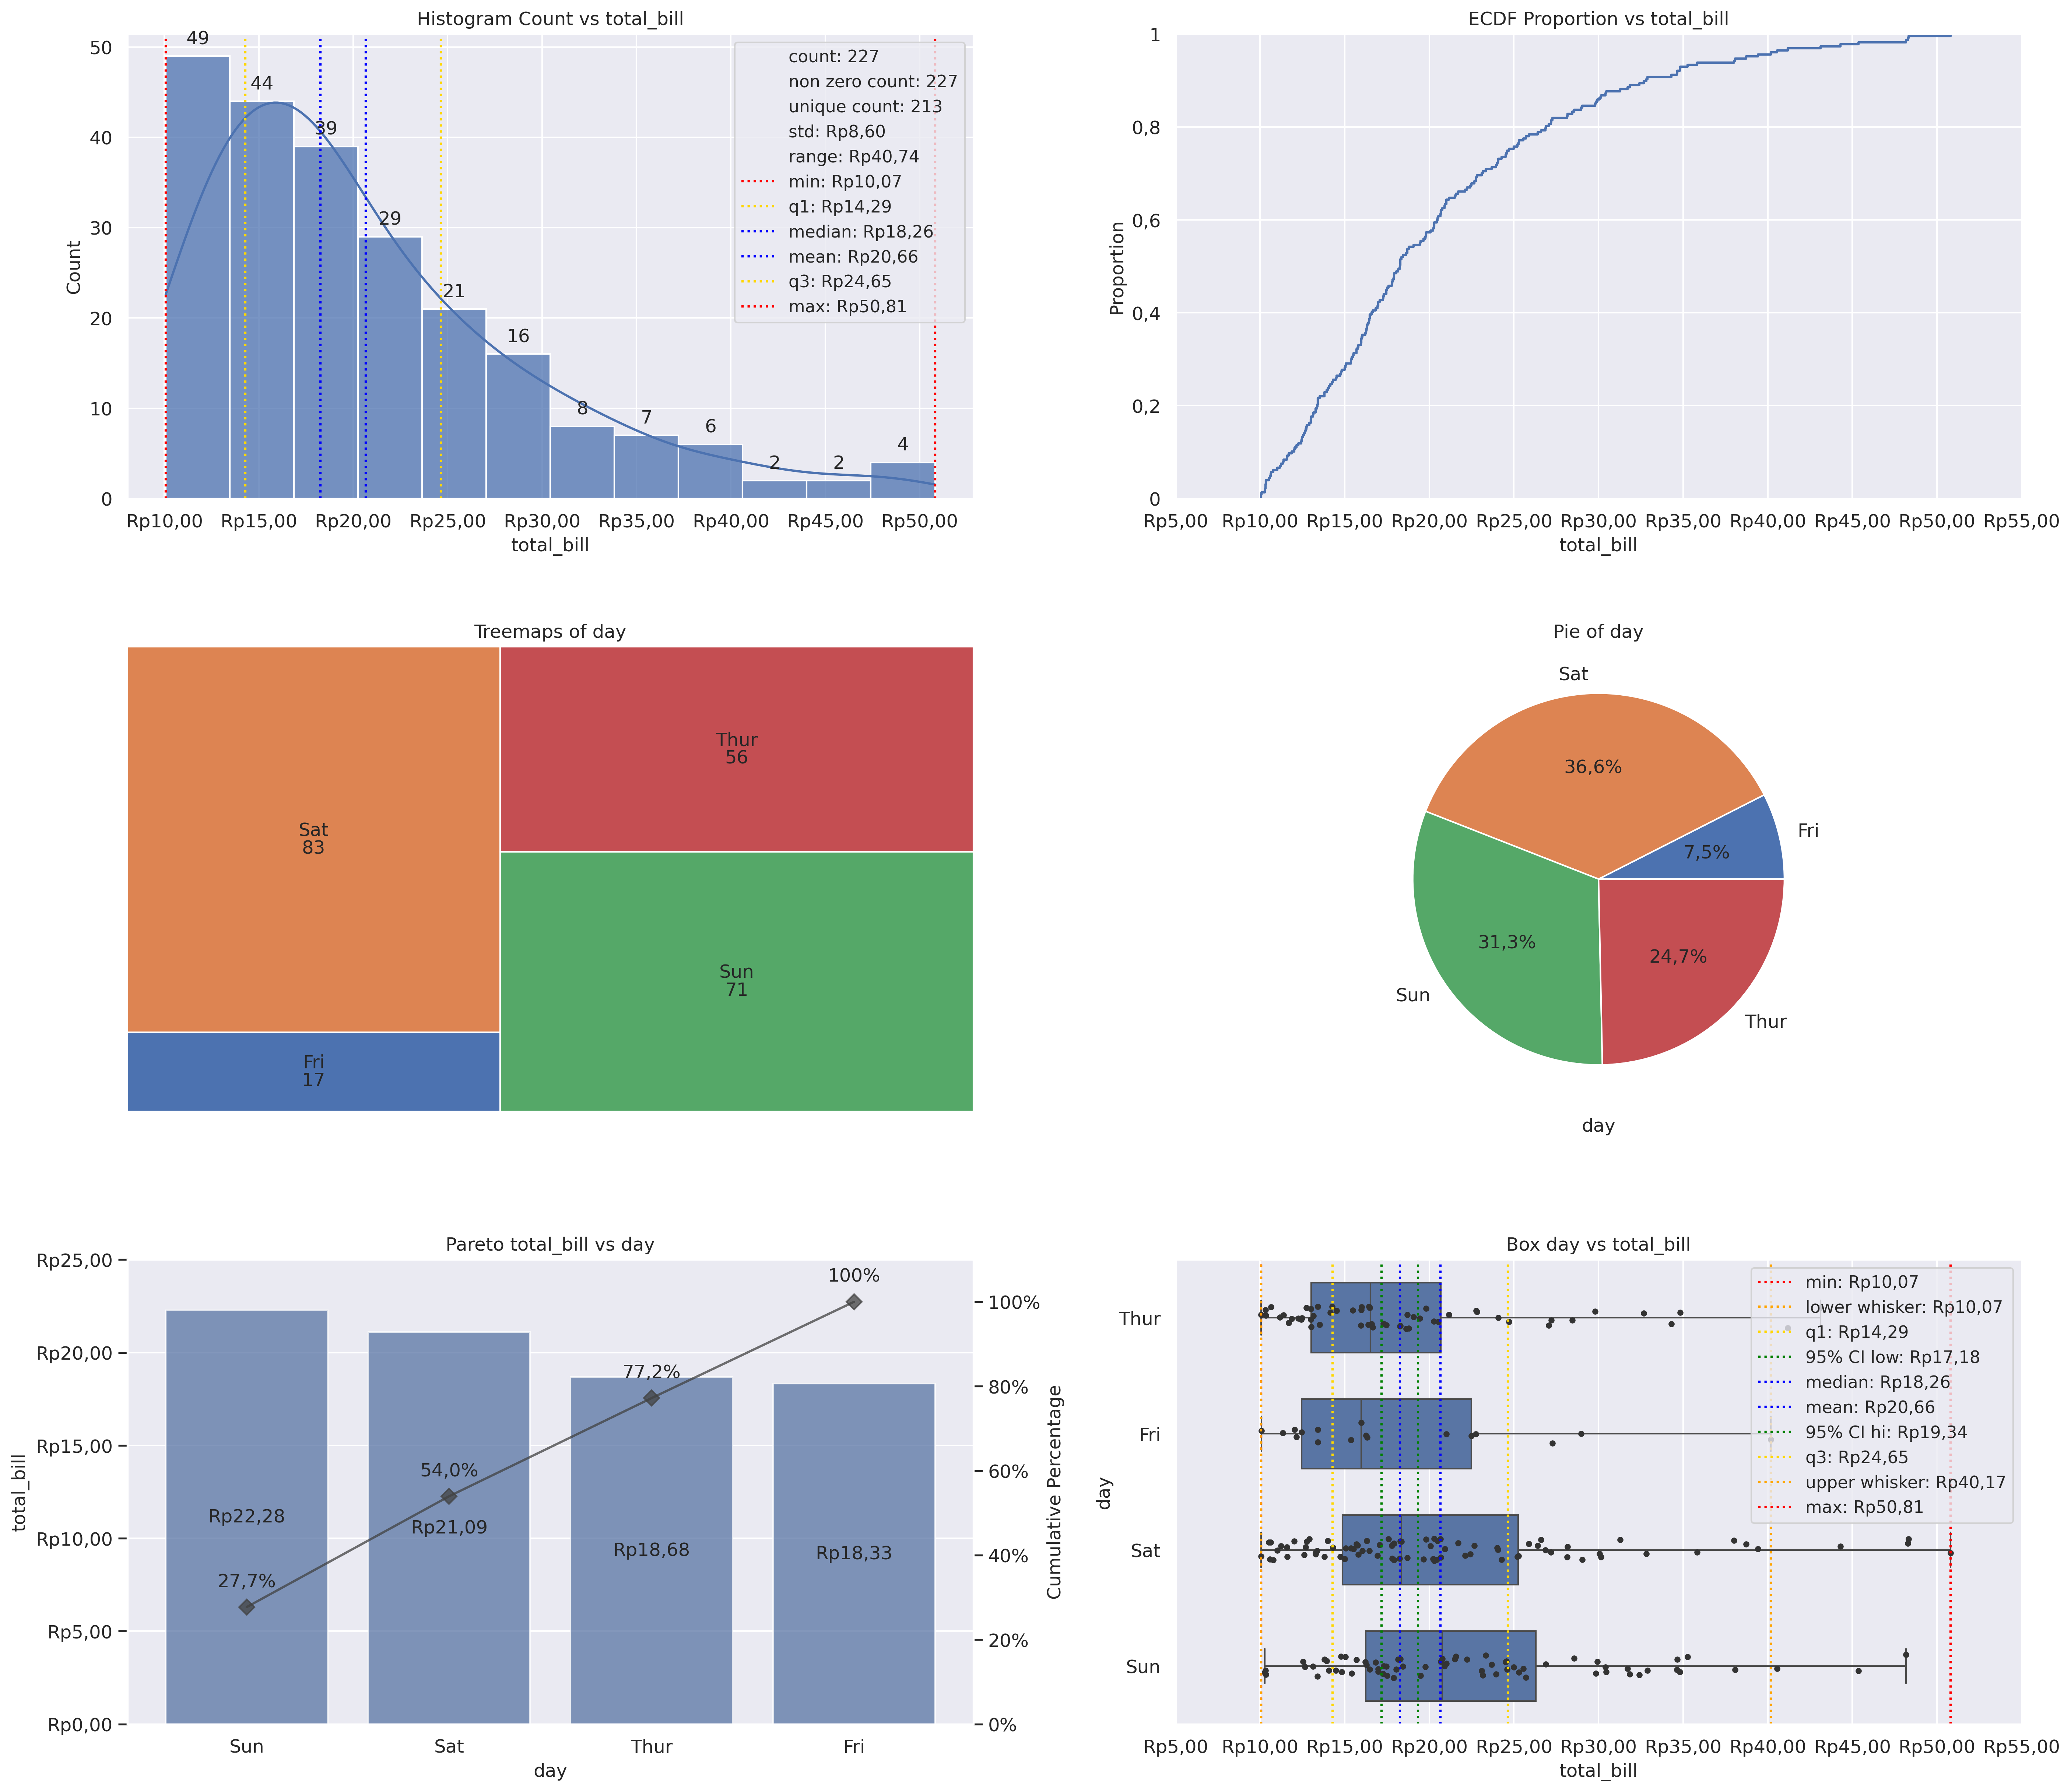
2 Dimensional
A 2-column, 3-row dashboard using the tips dataset. Subplot addresses
use '[i,j]' notation.
from grplot import plot2d
import grplot_seaborn as gs

gs.set_theme(context='notebook', style='darkgrid', palette='deep')

tips = gs.load_dataset('tips')
ax = plot2d(plot={'[1,1]': 'histplot',
                  '[1,2]': 'ecdfplot',
                  '[2,1]': 'treemapsplot',
                  '[2,2]': 'pieplot',
                  '[3,1]': 'paretoplot',
                  '[3,2]': 'boxplot+stripplot'},
            Nx=2,
            Ny=3,
            df=tips,
            filter=(tips['total_bill'] > 10),
            x=['total_bill', 'total_bill', 'day', 'day', 'day', 'total_bill'],
            y=[None, None, None, None, 'total_bill', 'day'],
            hpad=6,
            wpad=8,
            figsize=[18, 16],
            fontsize=12,
            legend_fontsize=11,
            sep={'total_bill': '.c',
                 '.': ['Count', 'Proportion', '[2,1]', '[2,2]', 'Cumulative Percentage']},
            statdesc={'[1,1]': {'total_bill': 'general'},
                      '[3,2]': {'total_bill': 'boxplot'}},
            text={'Count': 'h', True: ['[2,1]', '[2,2]'], '[3,1]': {'total_bill': 'h+i'}},
            tick_add={'total_bill': 'Rp(_)'},
            title={'[1,1]': 'Histogram Count vs total_bill',
                   '[1,2]': 'ECDF Proportion vs total_bill',
                   '[2,1]': 'Treemaps of day',
                   '[2,2]': 'Pie of day',
                   '[3,1]': 'Pareto total_bill vs day',
                   '[3,2]': 'Box day vs total_bill'},
            alpha={'[1,1]': 0.75, '[3,1]': 0.75},
            alpha2={'[3,1]': 0.75},
            kde=True)