ECDF Plot
Plot empirical cumulative distribution functions.
plot: 'ecdfplot'
Plot-Specific Parameters
hue(str, list, numpy.ndarray, pandas.core.indexes.base.Index, or None, default: None)Semantic variable that is mapped to determine the color of plot elements.
weights(str, list, numpy.ndarray, pandas.core.indexes.base.Index, or None, default: None)If provided, weight the contribution of the corresponding data points towards the cumulative distribution using these values.
stat(str, default: ‘proportion’)Distribution statistic to compute.
complementary(bool, default: False)If True, use the complementary CDF (1 - CDF).
palette(str, list, matplotlib.colors.Colormap, or None, default: None)Method for choosing the colors to use when mapping the hue semantic. String values are passed to color_palette(). List values imply categorical mapping, while a colormap object implies numeric mapping.
hue_order(list or None, default: None)Specify the order of processing and plotting for categorical levels of the hue semantic.
hue_norm(tuple, matplotlib.colors.Normalize, or None, default: None)Either a pair of values that set the normalization range in data units or an object that will map from data units into a 0 until 1 interval. Usage implies numeric mapping.
alpha(float or None, default: None)Proportional opacity of the points.
legend(bool, default: True)If False, suppress the legend for semantic variables.
zorder(int or None, default: None)Axes order. The default drawing order for axes is patches, lines, text for each plot order.
Example
from grplot import plot2d
import grplot_seaborn as gs
gs.set_theme(context='notebook', style='darkgrid', palette='deep')
tips = gs.load_dataset('tips')
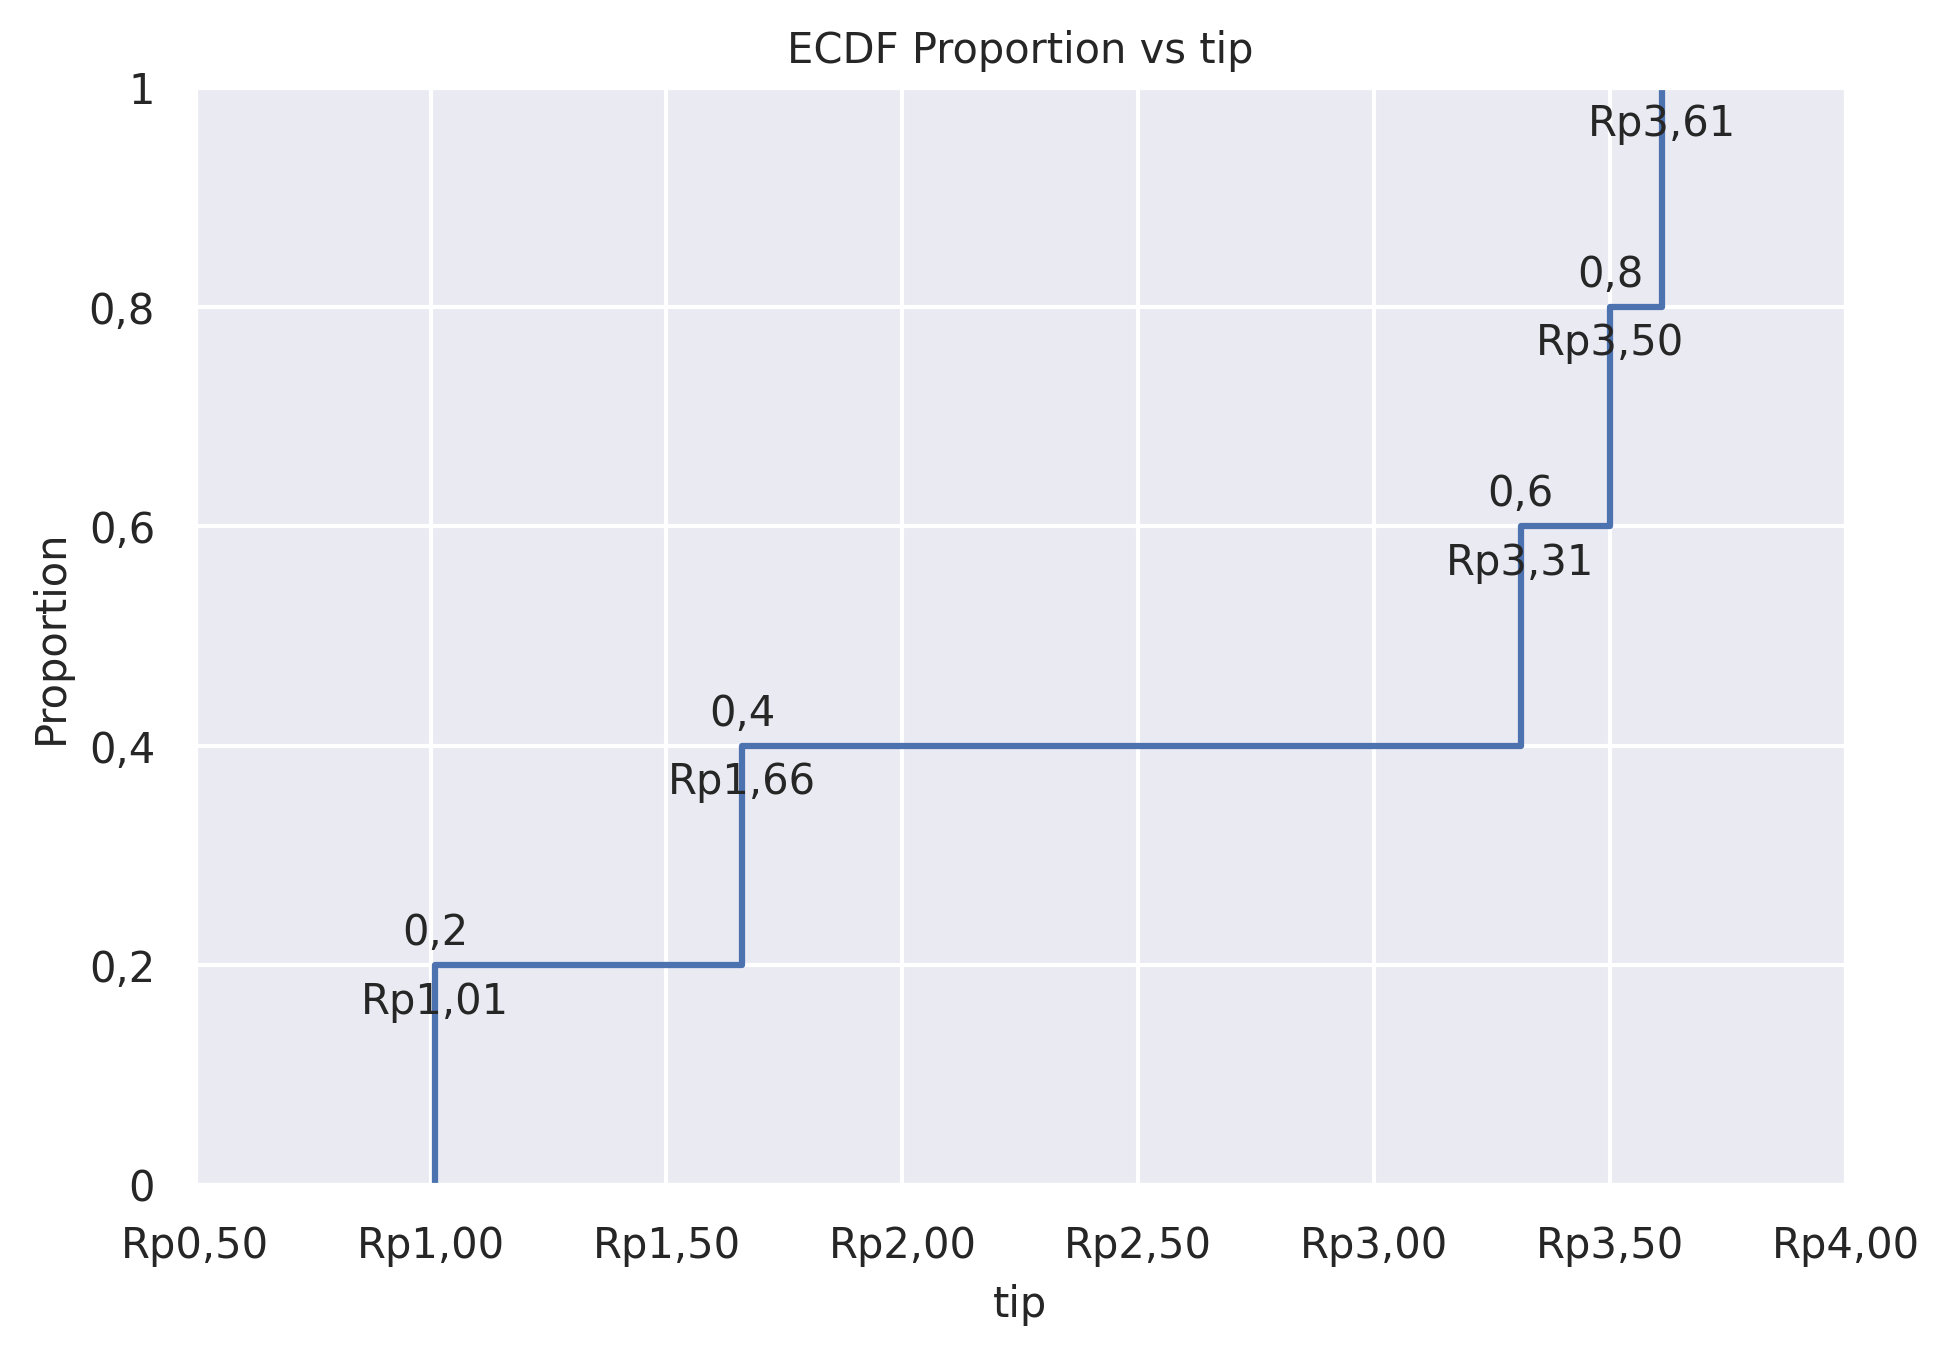
ax = plot2d(plot='ecdfplot',
df=tips.head(5),
x='tip',
xsep='.c',
ysep='.',
xtick_add='Rp(_)',
text=True,
title='ECDF Proportion vs tip')