Pie Plot
Visualize proportional data as a pie chart.
plot: 'pieplot'
Plot-Specific Parameters
explode(list or None, default: None)If not None, is a len(x) array which specifies the fraction of the radius with which to offset each wedge.
colors(list or None, default: None)A sequence of colors through which the pie chart will cycle. If None, will use the colors in the currently active cycle.
hatch(str, list, or None, default: None)Hatching pattern applied to all pie wedges or sequence of patterns through which the chart will cycle.
autopct(str, callable, or None, default: sep)If not None, is a string or function used to label the wedges with their numeric value. The label will be placed inside the wedge. If it is a format string, the label will be fmt % pct. If it is a function, it will be called.
pctdistance(float, default: 0.6)The ratio between the center of each pie slice and the start of the text generated by autopct. Ignored if autopct is None.
shadow(bool, default: False)Draw a shadow beneath the pie.
normalize(bool, default: True)When True, always make a full pie by normalizing x so that sum(x) == 1. False makes a partial pie if sum(x) <= 1.
labeldistance(float or None, default: 1.1)The radial distance at which the pie labels are drawn. If set to None, label are not drawn, but are stored for use in legend().
startangle(float, default: 0)The angle by which the start of the pie is rotated, counterclockwise from the x-axis.
radius(float, default: 1)The radius of the pie.
counterclock(bool, default: True)Specify fractions direction, clockwise or counterclockwise.
wedgeprops(dict or None, default: None)Dict of arguments passed to the wedge objects making the pie. For example, you can pass in wedgeprops = {‘linewidth’: 3} to set the width of the wedge border lines equal to 3. For more details, look at the doc/arguments of matplotlib wedge object. By default clip_on=False.
textprops(dict or None, default: None)Dict of arguments to pass to the text objects.
center([float, float], default: [0, 0])The coordinates of the center of the chart.
frame(bool, default: False)Plot Axes frame with the chart if true.
rotatelabels(bool, default: False)Rotate each label to the angle of the corresponding slice if true.
from grplot import plot2d
import grplot_seaborn as gs
gs.set_theme(context='notebook', style='darkgrid', palette='deep')
tips = gs.load_dataset('tips')
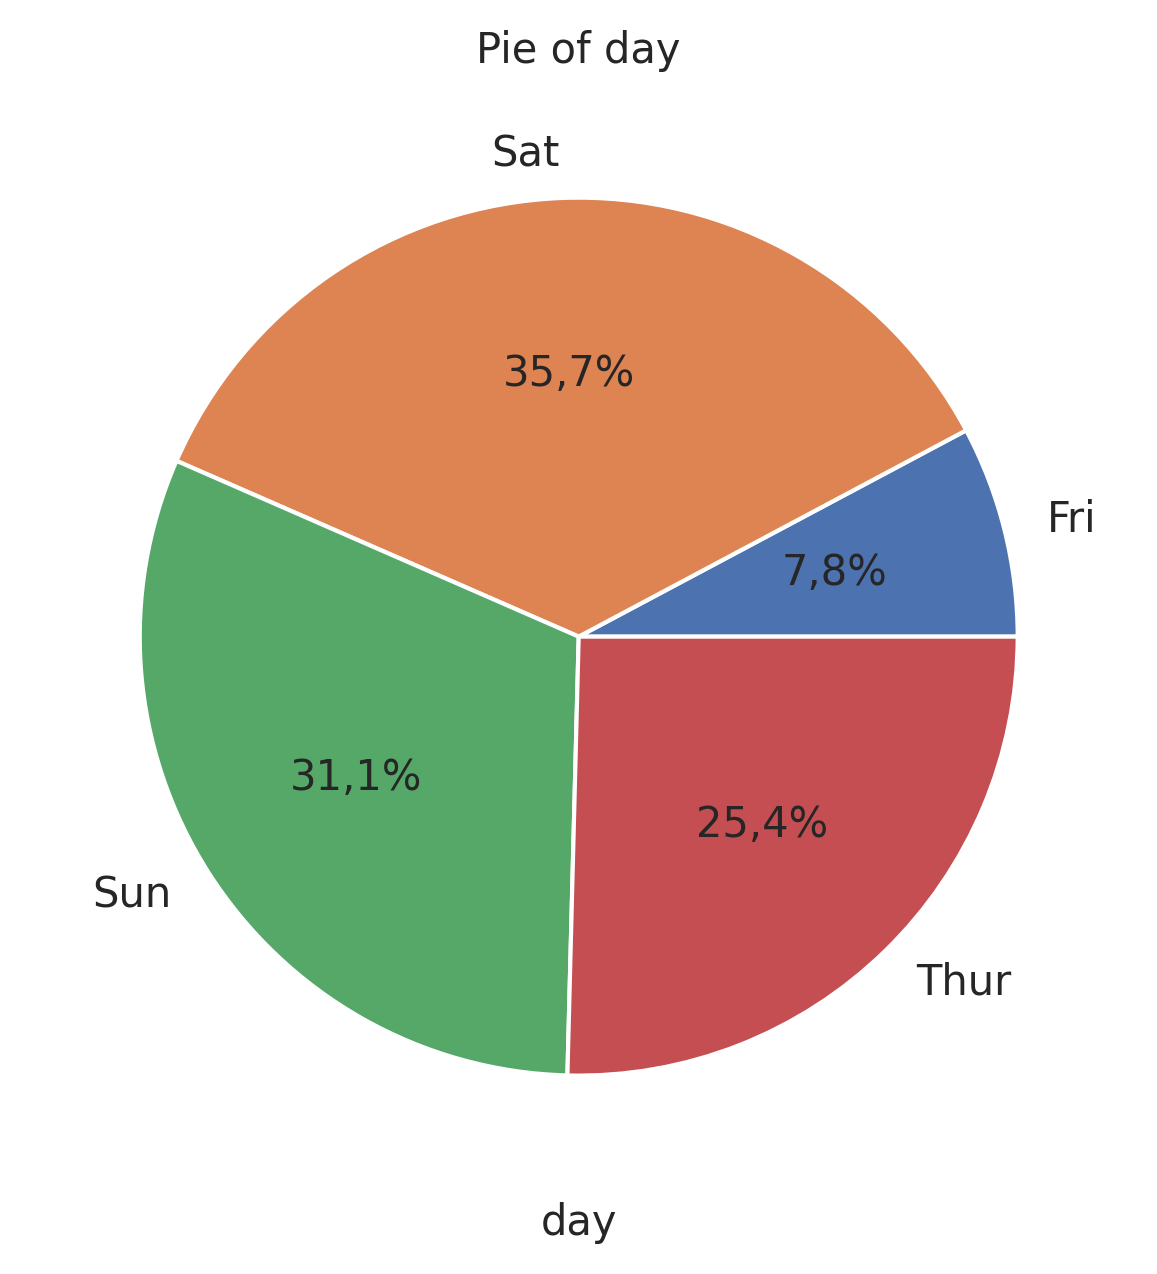
ax = plot2d(plot='pieplot',
df=tips,
x='day',
sep='.',
text=True,
title='Pie of day')