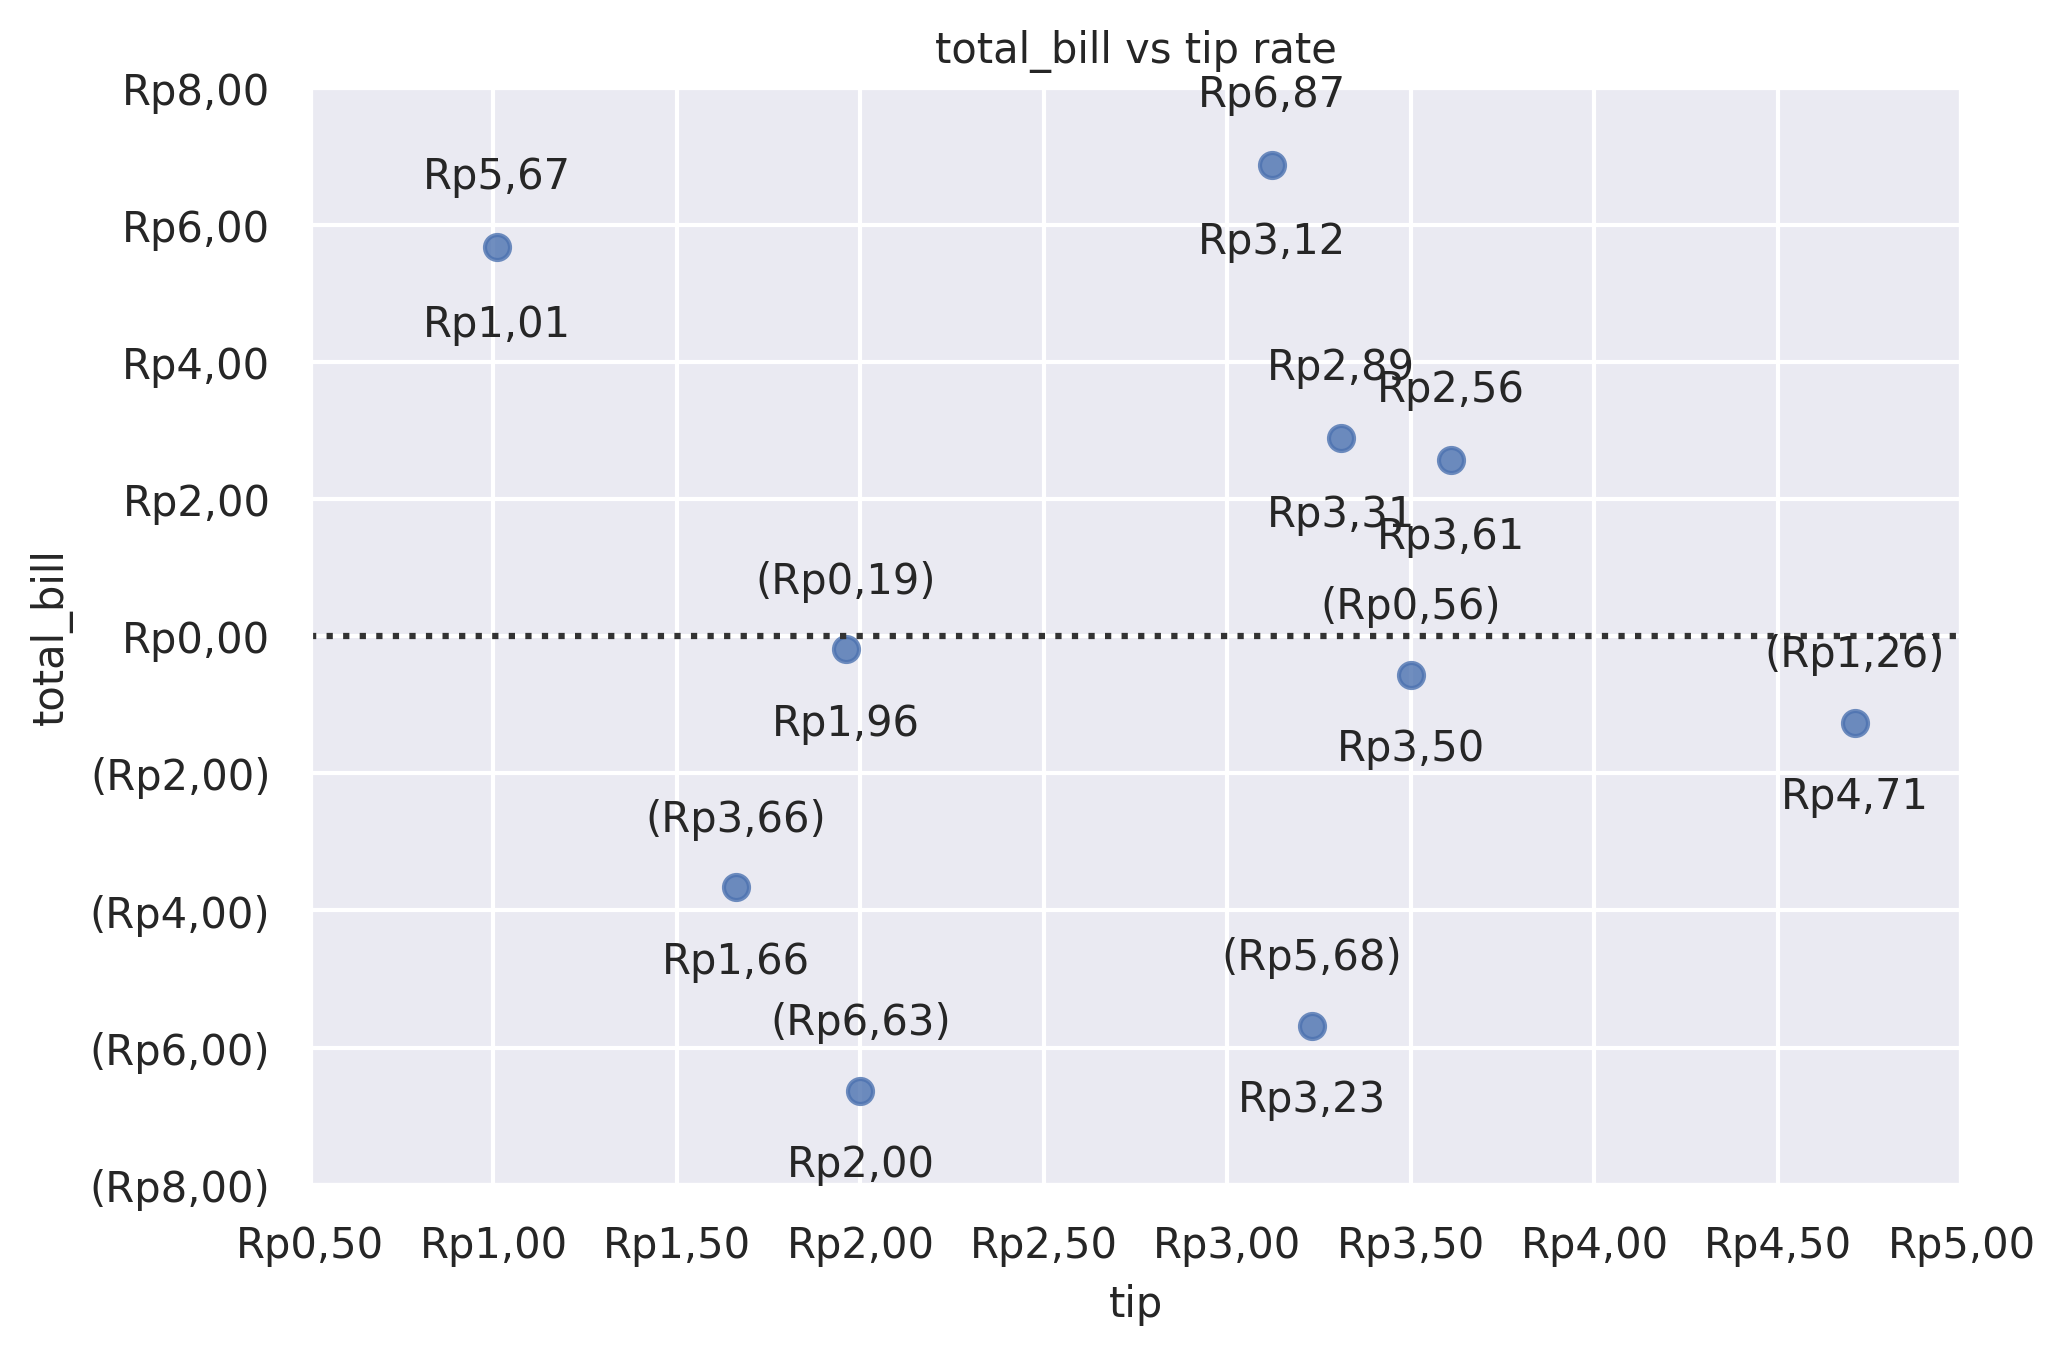
Resid Plot
Plot the residuals of a linear regression.
plot: 'residplot'
Plot-Specific Parameters
lowess(bool or None, default: False)Fit a lowess smoother to the residual scatterplot.
x_partial(str or None, default: None)Confounding variables to regress out of the x variable before plotting.
y_partial(str or None, default: None)Confounding variables to regress out of the y variable before plotting.
order(int or None, default: 1)Order of the polynomial to fit when calculating the residuals.
robust(bool or None, default: False)Fit a robust linear regression when calculating the residuals.
dropna(bool or None, default: True)If True, ignore observations with missing data when fitting and plotting.
label(str or None, default: None)Label that will be used in any plot legends.
color(matplotlib.colors or None, default: None)Color to use for all elements of the plot.
scatter_kws(dict or None, default: None)Additional keyword arguments to pass to plt.scatter.
line_kws(dict or None, default: None)Additional keyword arguments to pass to plt.plot.
from grplot import plot2d
import grplot_seaborn as gs
gs.set_theme(context='notebook', style='darkgrid', palette='deep')

tips = gs.load_dataset('tips')
ax = plot2d(plot='residplot',
            df=tips.head(10),
            x='tip',
            y='total_bill',
            sep='.c',
            text=True,
            tick_add='Rp(_)',
            title='total_bill vs tip rate')