Hist Plot
Plot univariate or bivariate histograms to show distributions of datasets.
plot: 'histplot'
Plot-Specific Parameters
hue(str, list, numpy.ndarray, pandas.core.indexes.base.Index, or None, default: None)Semantic variable that is mapped to determine the color of plot elements.
weights(str, list, numpy.ndarray, pandas.core.indexes.base.Index, or None, default: None)If provided, weight the contribution of the corresponding data points towards the count in each bin by these factors.
stat(str, default: ‘count’)Aggregate statistic to compute in each bin. - ‘count’, to show the number of observations in each bin. - ‘frequency’, to show the number of observations divided by the bin width. - ‘probability’ or ‘proportion’, to normalize such that bar heights sum to 1. - ‘percent’, to normalize such that bar heights sum to 100. - ‘density’, to normalize such that the total area of the histogram equals 1.
bins(str, float, or list, default: ‘auto’)Generic bin parameter that can be the name of a reference rule, the number of bins, or the breaks of the bins. Passed to numpy.histogram_bin_edges().
binwidth(float, pair of float, or None, default: None)Width of each bin, overrides bins but can be used with binrange.
binrange(pair of float, a pair of pairs, or None, default: None)Lowest and highest value for bin edges; can be used either with bins or binwidth. Defaults to data extremes.
discrete(bool or None, default: None)If True, default to binwidth=1 and draw the bars so that they are centered on their corresponding data points. This avoids ‘gaps’ that may otherwise appear when using discrete (integer) data.
cumulative(bool, default: False)If True, plot the cumulative counts as bins increase.
common_bins(bool, default: True)If True, use the same bins when semantic variables produce multiple plots. If using a reference rule to determine the bins, it will be computed with the full dataset.
common_norm(bool, default: True)If True and using a normalized statistic, the normalization will apply over the full dataset. Otherwise, normalize each histogram independently.
multiple(str, default: ‘layer’)Approach to resolving multiple elements when semantic mapping creates subsets. Only relevant with univariate data.
element(str, default: ‘bars’)Visual representation of the histogram statistic. Only relevant with univariate data.
fill(bool, default: True)If True, fill in the space under the histogram. Only relevant with univariate data.
shrink(float, default: 1)Scale the width of each bar relative to the binwidth by this factor. Only relevant with univariate data.
kde(bool, default: False)If True, compute a kernel density estimate to smooth the distribution and show on the plot as (one or more) line(s). Only relevant with univariate data.
kde_kws(dict or None, default: None)Parameters that control the KDE computation, as in kdeplot().
line_kws(dict or None, default: None)Parameters that control the KDE visualization, passed to matplotlib.axes.Axes.plot().
thresh(float or None, default: 0)Cells with a statistic less than or equal to this value will be transparent. Only relevant with bivariate data.
pthresh(float or None, default: None)Like thresh, but a value in the range 0 until 1 such that cells with aggregate counts (or other statistics, when used) up to this proportion of the total will be transparent.
pmax(float or None, default: None)A value in the range 0 until 1 that sets that saturation point for the colormap at a value such that cells below is constistute this proportion of the total count (or other statistic, when used).
cbar(bool, default: False)If True, add a colorbar to annotate the color mapping in a bivariate plot. Note: Does not currently support plots with a hue variable well.
cbar_ax(matplotlib.axes.Axes or None, default: None)Pre-existing axes for the colorbar.
cbar_kws(dict or None, default: None)Additional parameters passed to matplotlib.figure.Figure.colorbar().
palette(str, list, matplotlib.colors.Colormap, or None, default: None)Method for choosing the colors to use when mapping the hue semantic. String values are passed to color_palette(). List values imply categorical mapping, while a colormap object implies numeric mapping.
hue_order(list or None, default: None)Specify the order of processing and plotting for categorical levels of the hue semantic.
hue_norm(tuple, matplotlib.colors.Normalize, or None, default: None)Either a pair of values that set the normalization range in data units or an object that will map from data units into a 0 until 1 interval. Usage implies numeric mapping.
color(matplotlib.colors or None, default: None)Single color specification for when hue mapping is not used. Otherwise, the plot will try to hook into the matplotlib property cycle.
alpha(float or None, default: None)Proportional opacity of the points.
legend(bool, default: True)If False, suppress the legend for semantic variables.
zorder(int or None, default: None)Axes order. The default drawing order for axes is patches, lines, text for each plot order.
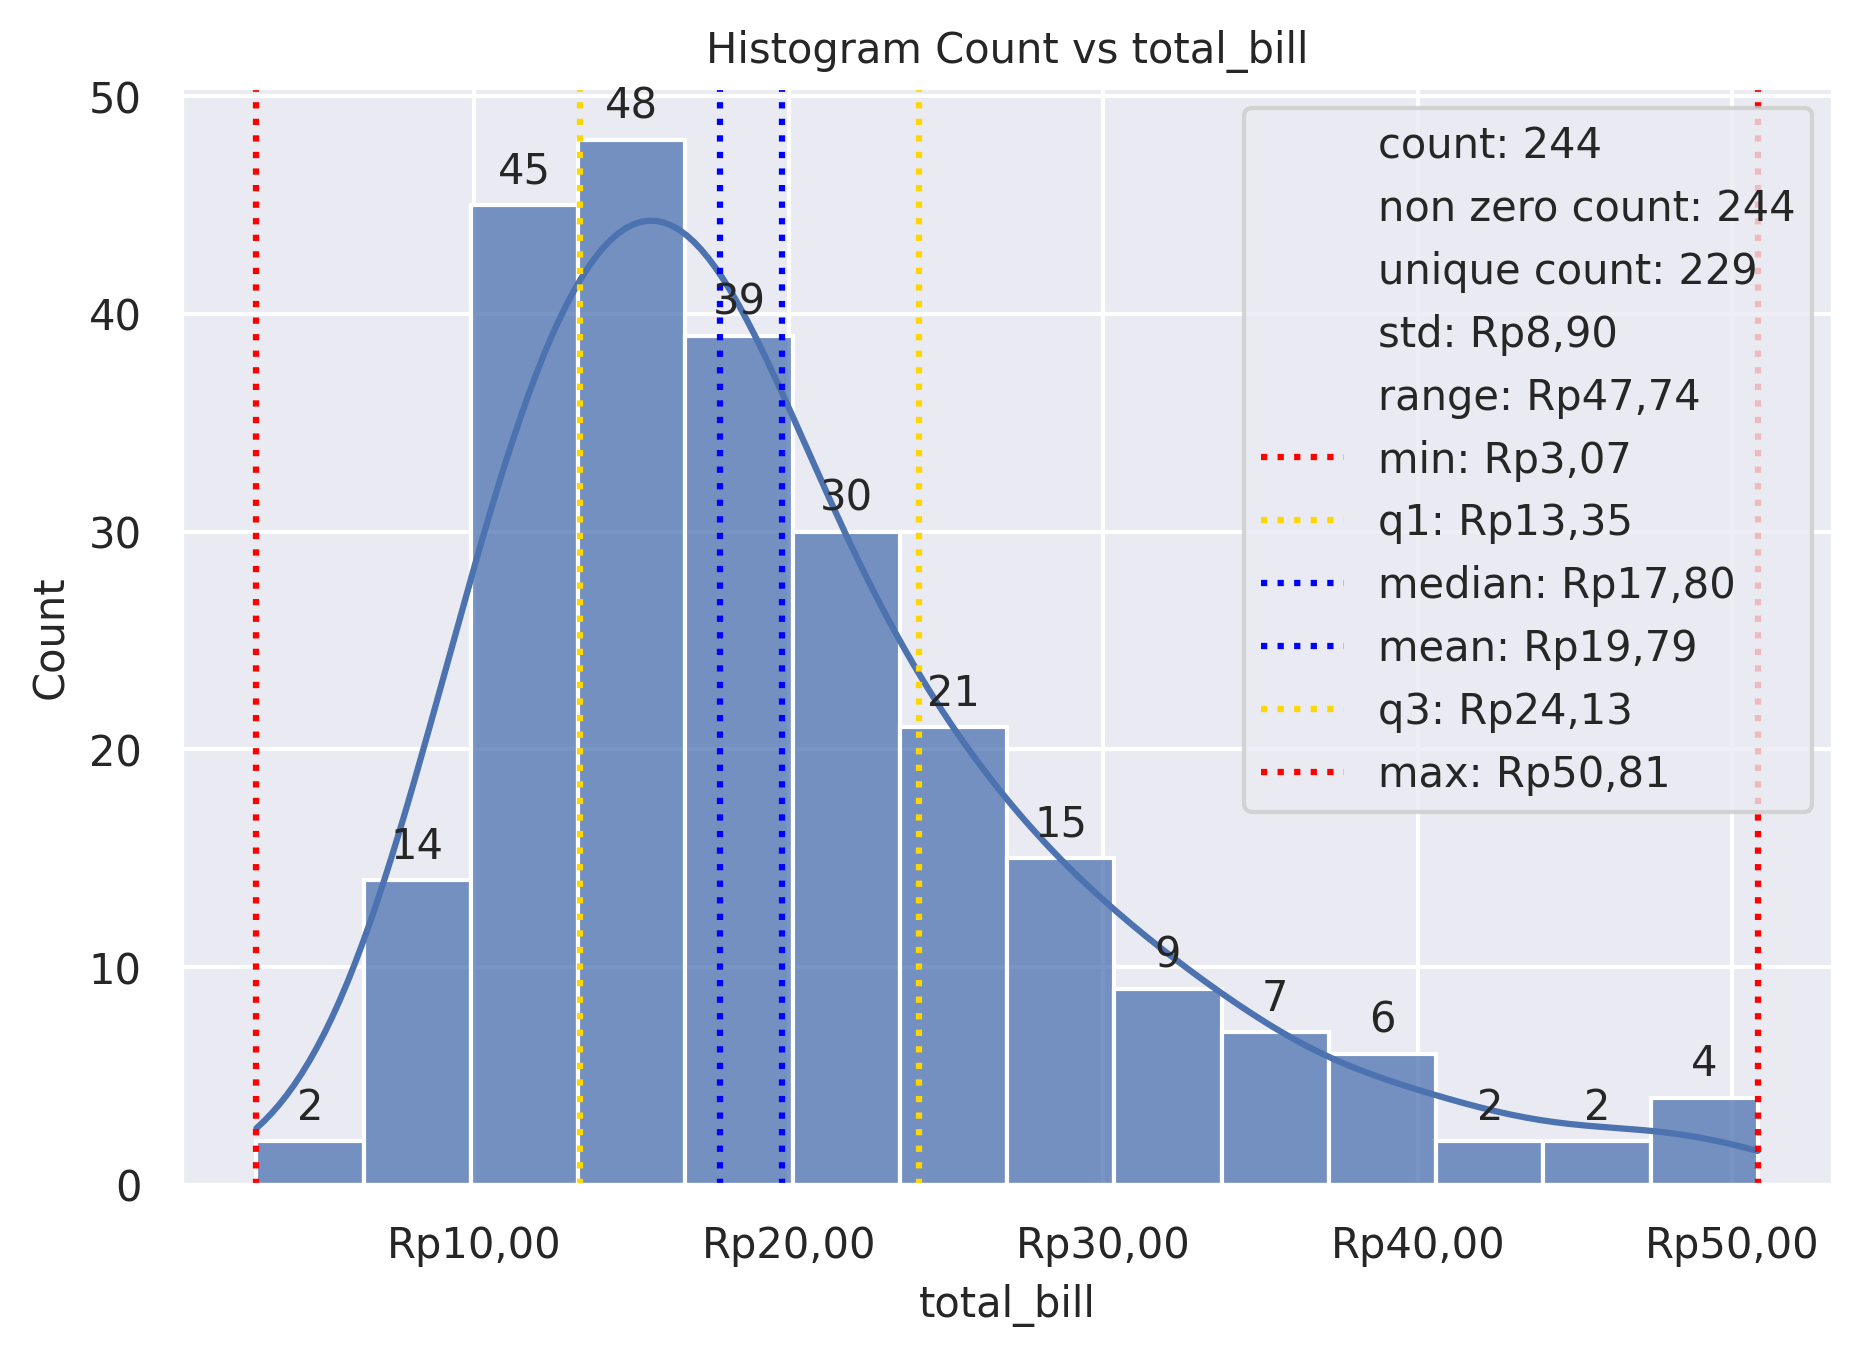
Example 1
from grplot import plot2d
import grplot_seaborn as gs
gs.set_theme(context='notebook', style='darkgrid', palette='deep')

tips = gs.load_dataset('tips')
ax = plot2d(plot='histplot',
            df=tips,
            x='total_bill',
            xsep='.c',
            ysep='.',
            ytext='h',
            statdesc={'total_bill': 'general'},
            xtick_add='Rp(_)',
            title='Histogram Count vs total_bill',
            alpha=0.75,
            kde=True)
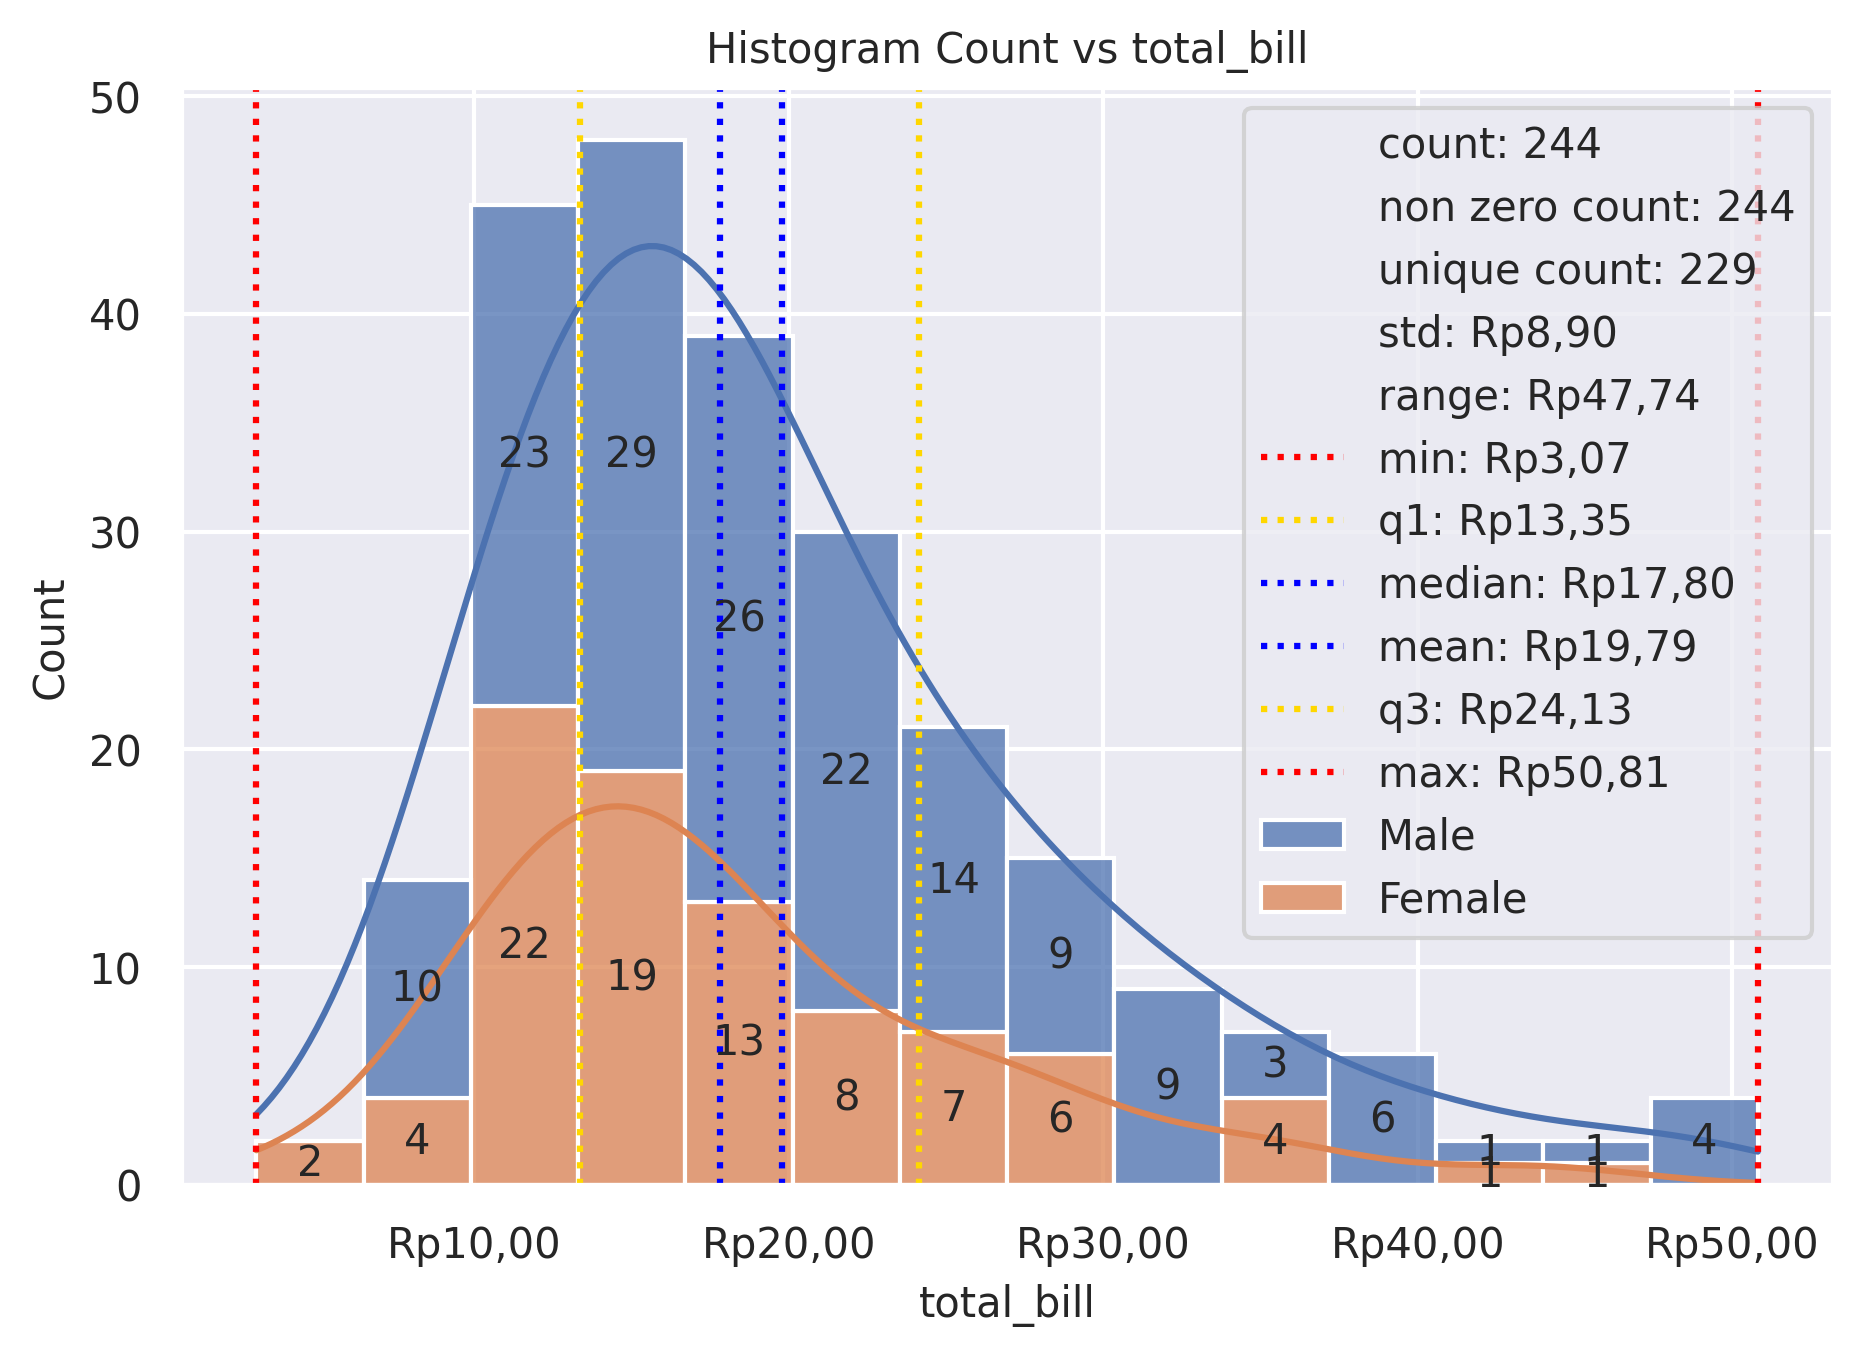
Example 2
from grplot import plot2d
import grplot_seaborn as gs
gs.set_theme(context='notebook', style='darkgrid', palette='deep')


tips = gs.load_dataset('tips')
ax = plot2d(plot='histplot',
            df=tips,
            x='total_bill',
            hue='sex',
            xsep='.c',
            ysep='.',
            statdesc={'total_bill':'general'},
            xtick_add='Rp(_)',
            ytext='h',
            title='Histogram Count vs total_bill',
            multiple='stack',
            kde=True,
            alpha=0.75)