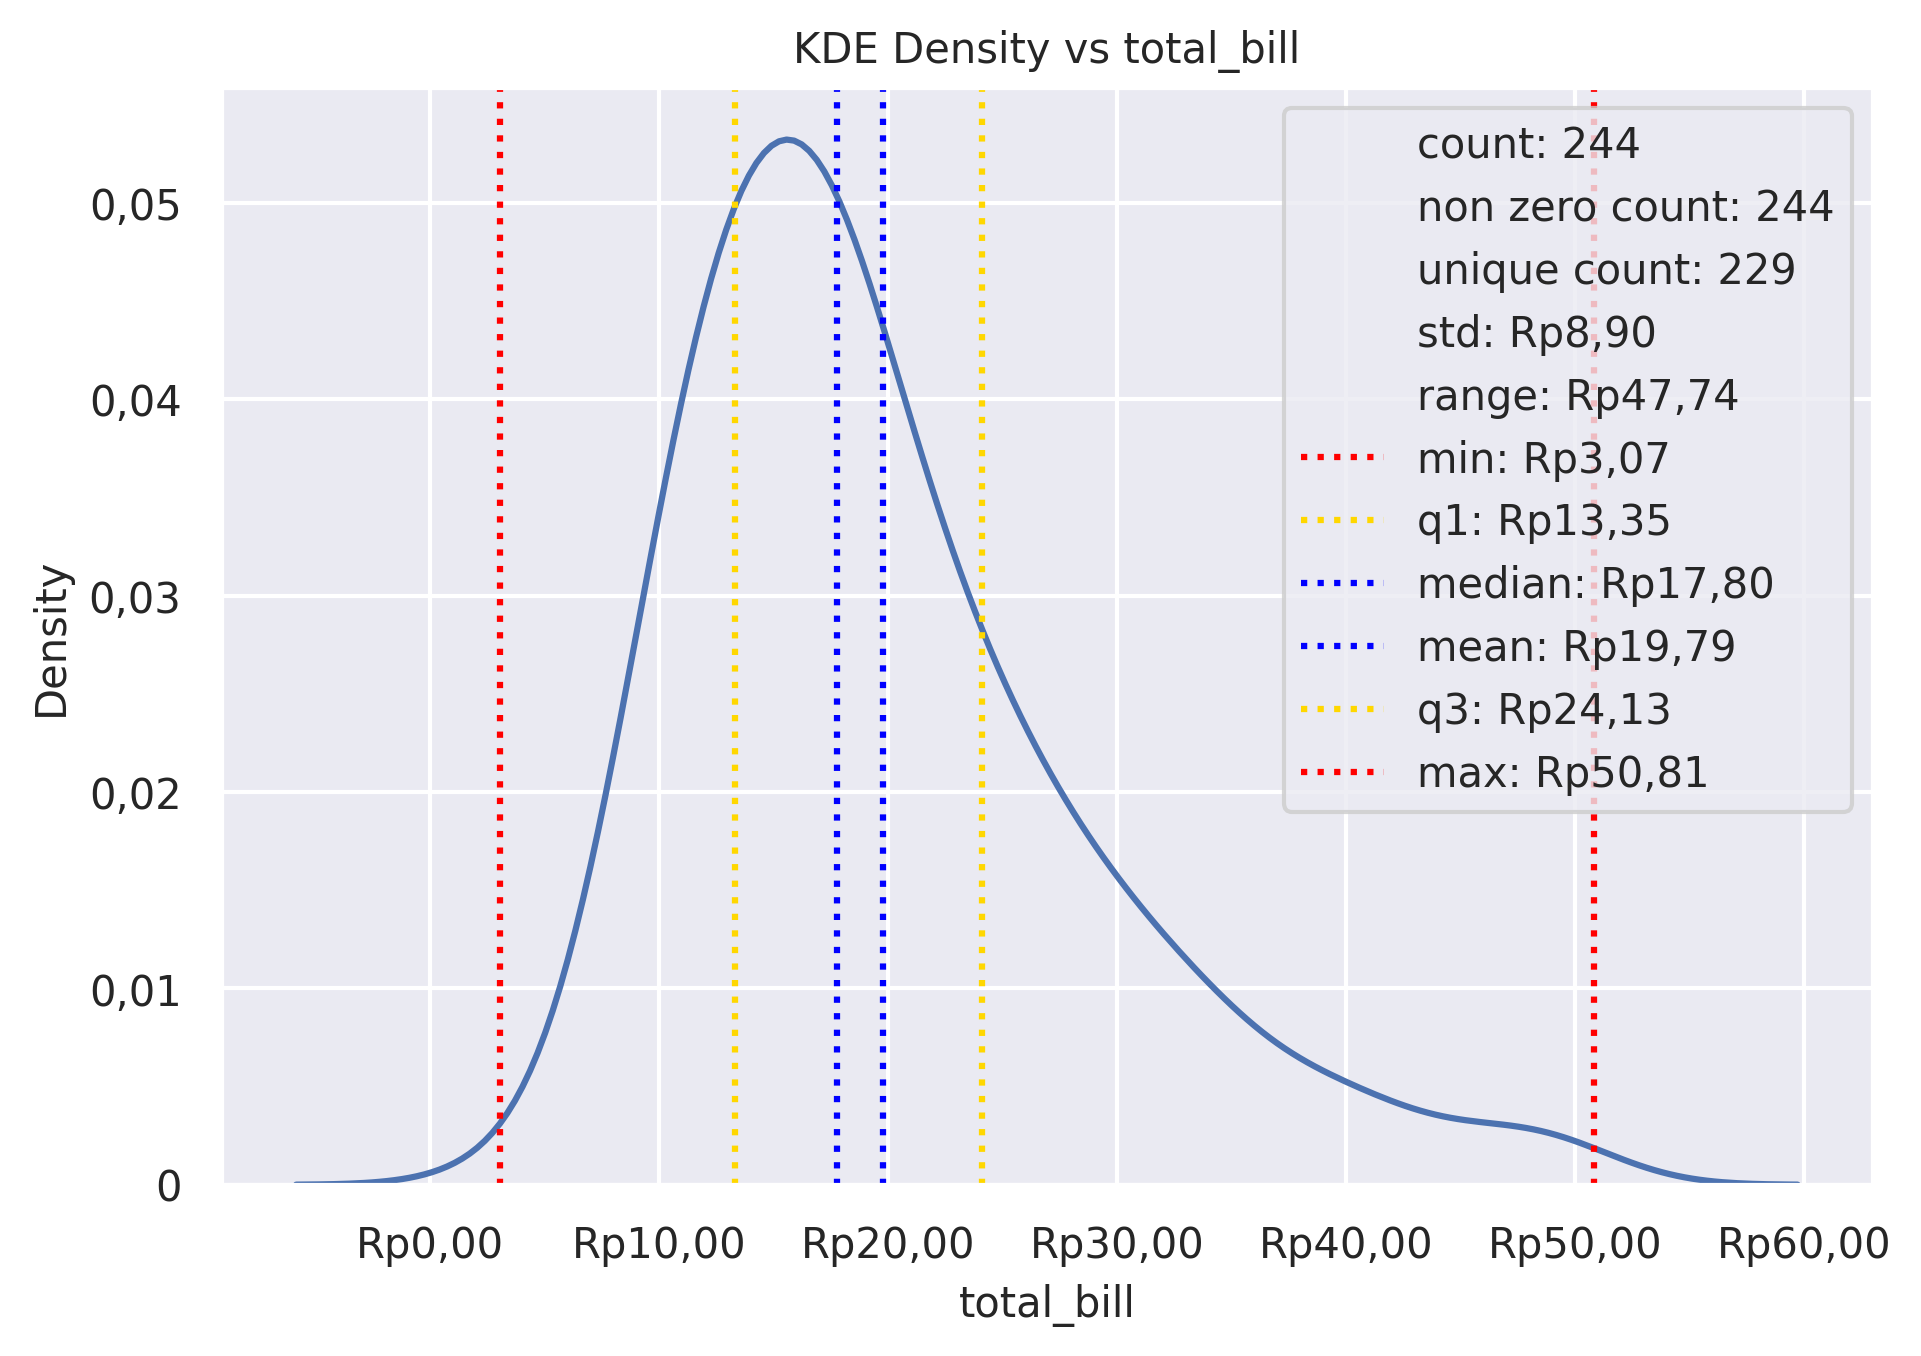
KDE Plot
Plot univariate or bivariate distributions using kernel density estimation.
plot: 'kdeplot'
Plot-Specific Parameters
hue(str, list, numpy.ndarray, pandas.core.indexes.base.Index, or None, default: None)Semantic variable that is mapped to determine the color of plot elements.
weights(str, list, numpy.ndarray, pandas.core.indexes.base.Index, or None, default: None)If provided, weight the kernel density estimation using these values.
palette(str, list, matplotlib.colors.Colormap, or None, default: None)Method for choosing the colors to use when mapping the hue semantic. String values are passed to color_palette(). List values imply categorical mapping, while a colormap object implies numeric mapping.
hue_order(list or None, default: None)Specify the order of processing and plotting for categorical levels of the hue semantic.
hue_norm(tuple, matplotlib.colors.Normalize, or None, default: None)Either a pair of values that set the normalization range in data units or an object that will map from data units into a 0 until 1 interval. Usage implies numeric mapping.
color(matplotlib.colors or None, default: None)Single color specification for when hue mapping is not used. Otherwise, the plot will try to hook into the matplotlib property cycle.
fill(bool or None, default: None)If True, fill in the area under univariate density curves or between bivariate contours. If None, the default depends on multiple.
multiple(str, default: ‘layer’)Method for drawing multiple elements when semantic mapping creates subsets. Only relevant with univariate data.
common_norm(bool, default: True)If True, scale each conditional density by the number of observations such that the total area under all densities sums to 1. Otherwise, normalize each density independently.
common_grid(bool, default: False)If True, use the same evaluation grid for each kernel density estimate. Only relevant with univariate data.
cumulative(bool, default: False)If True, estimate a cumulative distribution function.
bw_method(str, scalar, or callable, default: ‘scott’)Method for determining the smoothing bandwidth to use; passed to scipy.stats.gaussian_kde.
bw_adjust(float, default: 1)Factor that multiplicatively scales the value chosen using bw_method. Increasing will make the curve smoother.
warn_singular(bool, default: True)If True, issue a warning when trying to estimate the density of data with zero variance.
levels(int or list, default: 10)Number of contour levels or values to draw contours at. A vector argument must have increasing values in the range 0 until 1. Levels correspond to iso-proportions of the density: e.g., 20% of the probability mass will lie below the contour drawn for 0.2. Only relevant with bivariate data.
thresh(float, default: 0.05)Lowest iso-proportion level at which to draw a contour line. Ignored when levels is a vector. Only relevant with bivariate data.
gridsize(int, default: 200)Number of points on each dimension of the evaluation grid.
cut(float, default: 3)Factor, multiplied by the smoothing bandwidth, that determines how far the evaluation grid extends past the extreme datapoints. When set to 0, truncate the curve at the data limits.
clip(pair of float, a pair of such pairs, or None, default: None)Do not evaluate the density outside of these limits.
legend(bool, default: True)If False, suppress the legend for semantic variables.
cbar(bool, default: False)If True, add a colorbar to annotate the color mapping in a bivariate plot. Note: Does not currently support plots with a hue variable well.
cbar_ax(matplotlib.axes.Axes or None, default: None)Pre-existing axes for the colorbar.
cbar_kws(dict or None, default: None)Additional parameters passed to matplotlib.figure.Figure.colorbar().
alpha(float or None, default: None)Proportional opacity of the points.
zorder(int or None, default: None)Axes order. The default drawing order for axes is patches, lines, text for each plot order.
Example
from grplot import plot2d
import grplot_seaborn as gs
gs.set_theme(context='notebook', style='darkgrid', palette='deep')

tips = gs.load_dataset('tips')
ax = plot2d(plot='kdeplot',
            df=tips,
            x='total_bill',
            xsep='.c',
            ysep='.',
            statdesc={'total_bill': 'general'},
            xtick_add='Rp(_)',
            title='KDE Density vs total_bill')