Packed Bubbles Plot
Display hierarchical data as packed circles.
plot: 'packedbubblesplot'
Plot-Specific Parameters
bubble_spacing(float, default: 0.1)Space between bubbles.
color(list or None, default: None)A sequence of colors through which the packed bubbles chart will cycle. If None, will use the colors in the currently active cycle.
from grplot import plot2d
import grplot_seaborn as gs
gs.set_theme(context='notebook', style='darkgrid', palette='deep')
tips = gs.load_dataset('tips')
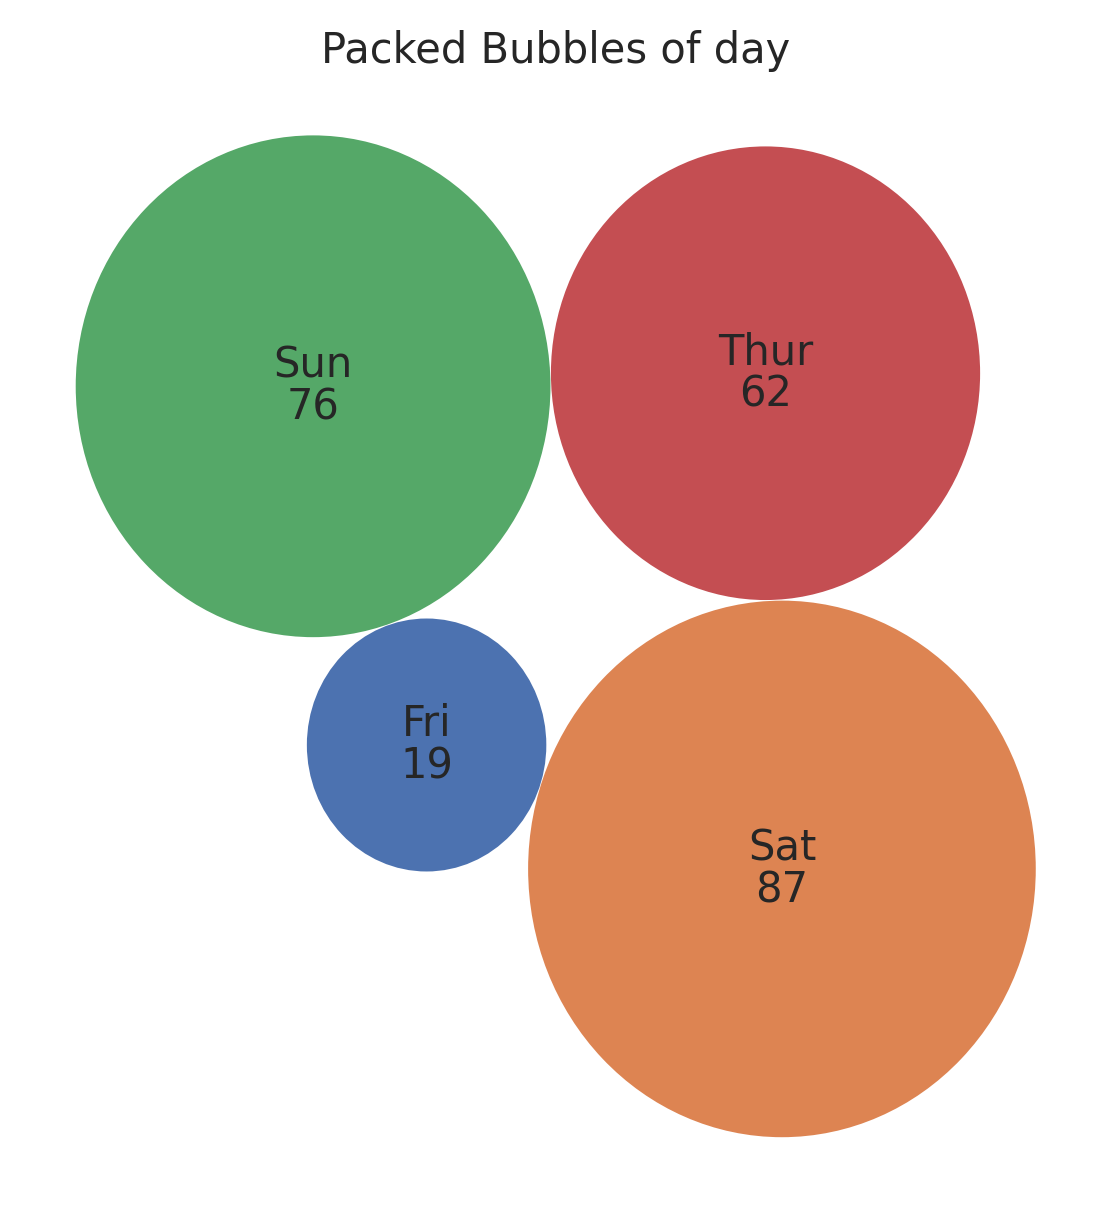
ax = plot2d(plot='packedbubblesplot',
df=tips,
x='day',
figsize=[6, 6],
sep='.',
text=True,
title='Packed Bubbles of day')